Welcome to
Visualize your Science's Blog
Why visual communication matters in science
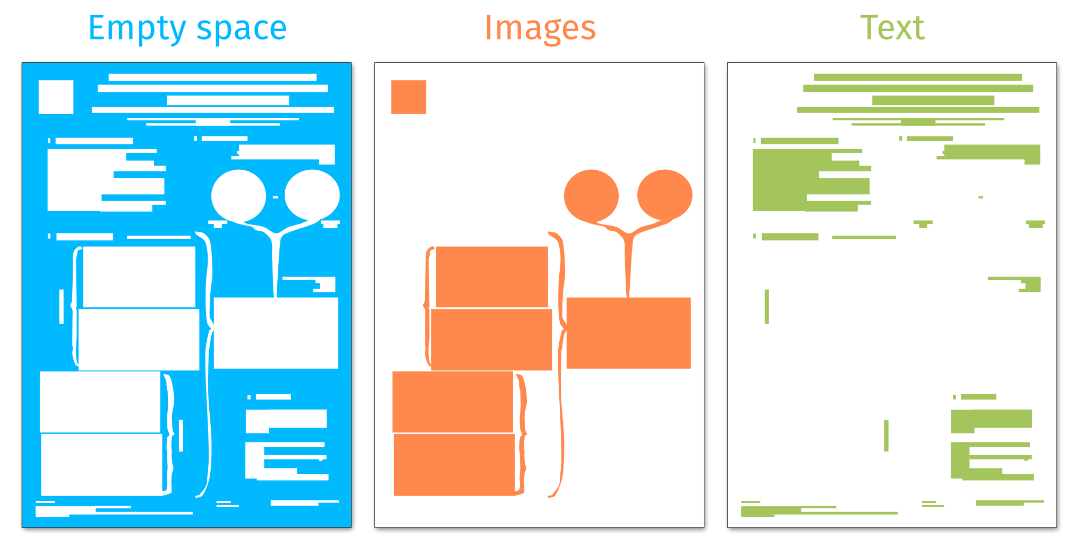
As scientists, we spend many hours perfecting our research, analyzing data, and preparing manuscripts to share our findings. But when it comes to communicating that work—whether through papers, conference posters, or presentations—we often give our scientific visual not so much attention.
Visuals aren’t just nice to have; they’re an important means for effectively communicating complex ideas. A strong figure or graphical abstract can make our work stand out, enhance understanding, and contribute to making our proposals more convincing. Yet many of us might feel that we do not have enough time to create these visuals or feel that we lack the skills that are needed to create them. Many of us rely on tools like PowerPoint or pre-made templates, which can feel limiting to our creativity and professionalism.
This is where we should discuss vector graphics and design principles. Investing time in learning these skills can really change how you communicate your research, giving you the tools to create visuals that are professional, scalable, and uniquely yours.
Using illustration libraries
If designing from scratch feels very time-consuming or overwhelming, illustration libraries can be a useful resource. They offer ready-to-use icons and visuals that can complement your work.
Available libraries to find icons:
Available libraries to find icons:
- BioIcons: A growing collection of CC0 life science illustrations and lab equipment icons.
- NIH BioArt: Free, high-quality medical and scientific visuals in vector formats.
- PhyloPic: Silhouettes of animals, plants, and other life forms under Creative Commons licenses.
- Reactome: A curated database of human biology pathways with customizable illustrations.
- OCHA Humanitarian Icons: which cover themes of interest to the humanitarian community such as clusters, disaster types, categories of affected people, and relief items.
While these libraries can be useful, they may not always provide exactly what you are looking for. Learning vector graphic design can be useful to make changes to these resources (if licencing allows) or create entirely new visuals from scratch. That way, they fit the style and you can integrate them into your overall design.
Platforms for creating science visuals
Platforms for creating science visuals
If you’ve explored platforms like BioRender or Mind the Graph, you know they can be appealing for quickly creating scientific visuals. These platforms provide extensive libraries of pre-made icons and templates, and they’re designed specifically for scientists.
What makes these platforms useful?
• Time-saving: Perfect for tight deadlines or when you need something right away.
• User-friendly: They are developed for non-designers and offer an easy interface to download figures or create posters.
However, while these platforms have their benefits, they also come with significant limitations:
• Cost: Subscriptions can be pricey, and not all universities provide institutional access.
• Licensing restrictions: Content created on these platforms isn’t always entirely yours. Licensing agreements may limit how and where you can use the visuals.
• Uniform style: Pre-made templates and icons often result in visuals that look generic or overly templated, making it harder for your work to stand out.
• Limited customization: While these tools offer many options, they can’t always provide the specific item, look or style you want.
These platforms can be helpful for quick solutions, but they shouldn’t replace learning how to create your visuals. Investing in building your own design skills will give you full control, and creative freedom to be able to clearly present your unique research.
Why vector graphics?
Vector graphics are created using mathematical equations rather than pixels. Unlike raster images (think JPGs or PNGs), they can be scaled infinitely without losing quality. This makes them ideal for scientific visuals, which we might use in figures for articles or as a large figure on an A0 poster and want to be able to easily adapt them.
By learning to create vector graphics, you can create visuals that communicate effectively, are adaptable, and can be changed in the future.
There are more advantages to it:
Advantages of Vector Graphics:
- Scalable: Whether you're presenting on a poster, in a PowerPoint, or a published paper, your visuals will never risk being blurry or pixelated.
- Customisable: You can easily make changes, and adjust colors, shapes, strokes, and fonts so that you can change and fit the style to the context.
By learning to create vector graphics, you can create visuals that communicate effectively, are adaptable, and can be changed in the future.
There are more advantages to it:
- Professional appearance: Vector graphics look professional and polished.
- High accuracy: One can make graphics very accurate. This is essential for scientific images.
- Clarity: Vector graphics, compared to photos, can be much clearer and to the point.
Best tools to create vector graphic illustrations
Many scientists use Power Point for figures and illustrations, but it has significant limitations. It is not designed for advanced illustration work and can make your design clunky and inaccurate. Thankfully there are better tools specifically to create vector graphics.
Here’s a quick overview* of some great options:
Free Solution:
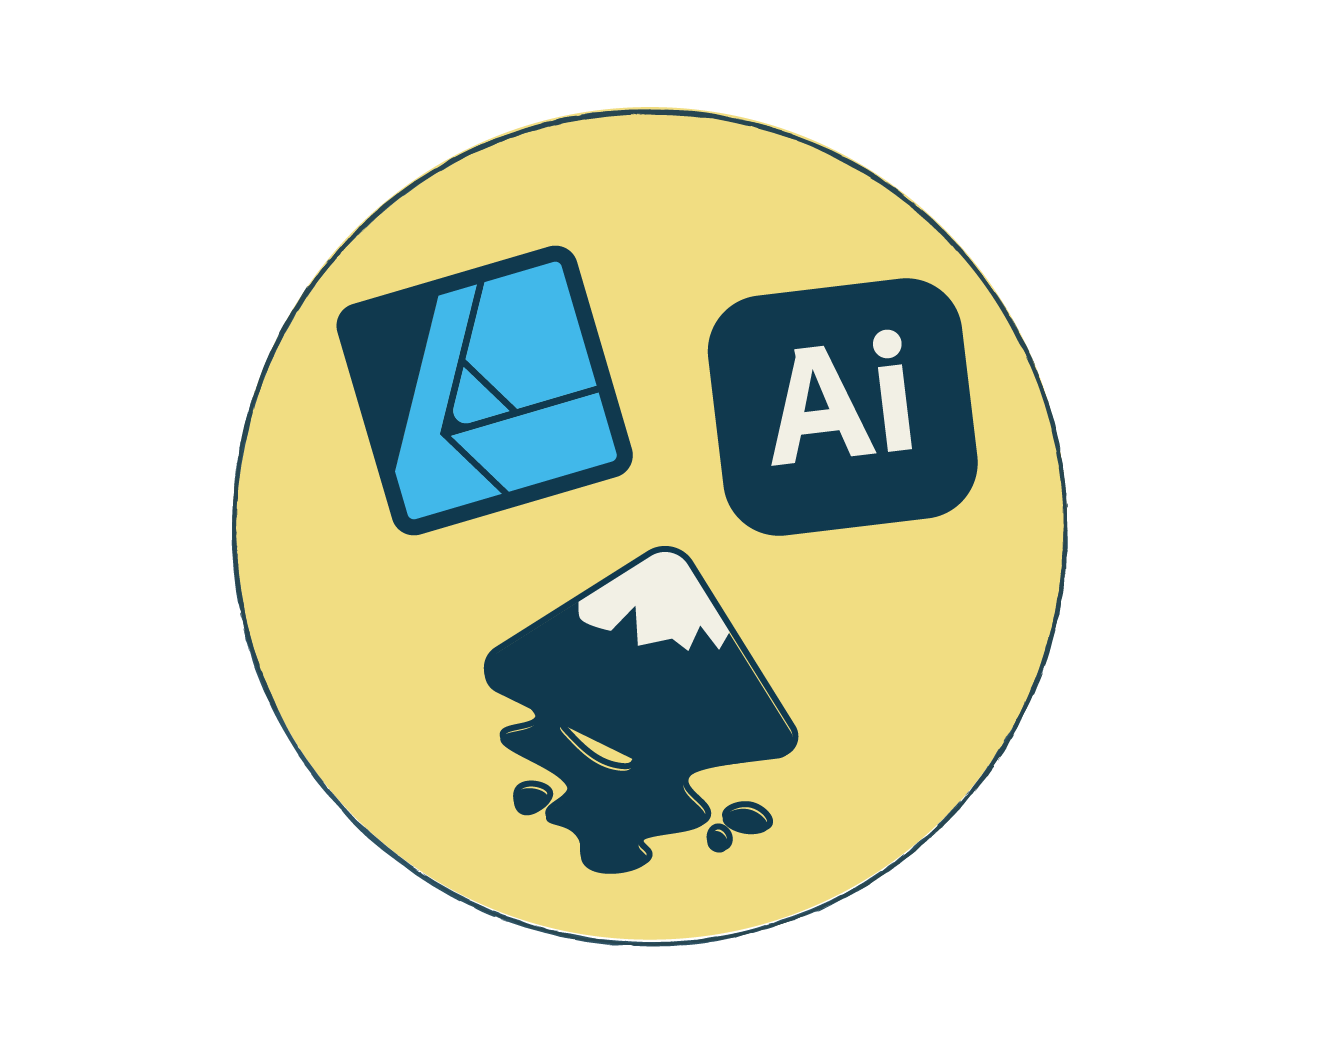
Inkscape
Inkscape is a powerful, community-supported tool with extensive functionalities and a lot of tutorials to help you get started. It’s ideal if you’re just beginning and don’t want to spend money upfront, and even for advanced scientific illustrations, it is a very good tool.
Commercial Solutions:
Affinity designer
Affinity Designer is a robust tool with professional-grade features and integration into other Affinity products. The one-time purchase costs make it quite affordable.
Adobe Illustrator
Adobe Illustrator is the industry standard and top choice for experienced designers due to advanced tools and integration with other Adobe products. However, its monthly subscription model makes it pricy.
*For a more detailed comparison of these tools, check out our earlier blog post.
Artificial Intelligence in scientific visuals
AI has made significant advances, using machine learning algorithms to find data patterns and mimic human neural networks, it has also the ability to create images on demand using for instance DALL-E (ChatGPT) or MidJourney.
These tools are very powerful but they have their flaws. Especially for scientific visuals don't trust them blindly; check for inaccuracies.
Challenges:
These tools are very powerful but they have their flaws. Especially for scientific visuals don't trust them blindly; check for inaccuracies.
Challenges:
Authorship and Copyright:
While AI-generated text doesn't usually require authorship attribution, AI-generated images raise copyright and research integrity concerns. Proper disclosure of AI use is crucial to maintain scientific integrity and trust.
Legal issues are unresolved, but some journals have clear guidelines.
Legal issues are unresolved, but some journals have clear guidelines.
For example, Springer Nature and Science journals prohibit AI-generated images except in specific cases, allowing AI-generated text and numerical materials.
Accuracy:
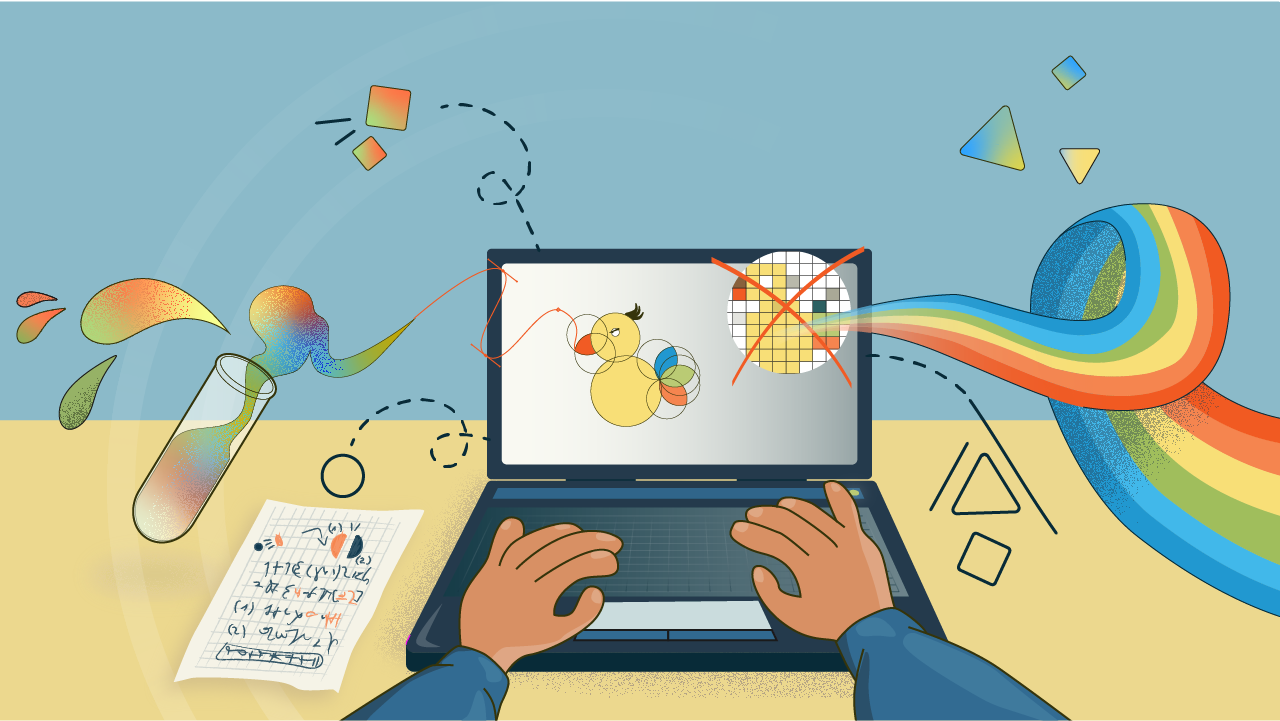
When AI generates an image, it does not consider scientific accuracy. AI is not built to do that. This means that images tend to be inaccurate and even incorrect. If you plan to use AI-generated images, careful verifications and adjustments are necessary.
One well-known example of this issue occurred in Frontiers in Cell and Developmental Biology on February 14th, 2024, where an AI-generated image was published with an article. The image, which depicted rat testes and other diagrams, looked awkward and contained errors, including labels that made no sense.
Benefits:
Ideation and Inspiration: AI can be a great tool for ideation and inspiration, helping with composition, color schemes, and styles. It can provide a good starting point.
Conclusion: Learning design skills matters
Katrin Beilharz
Back to the