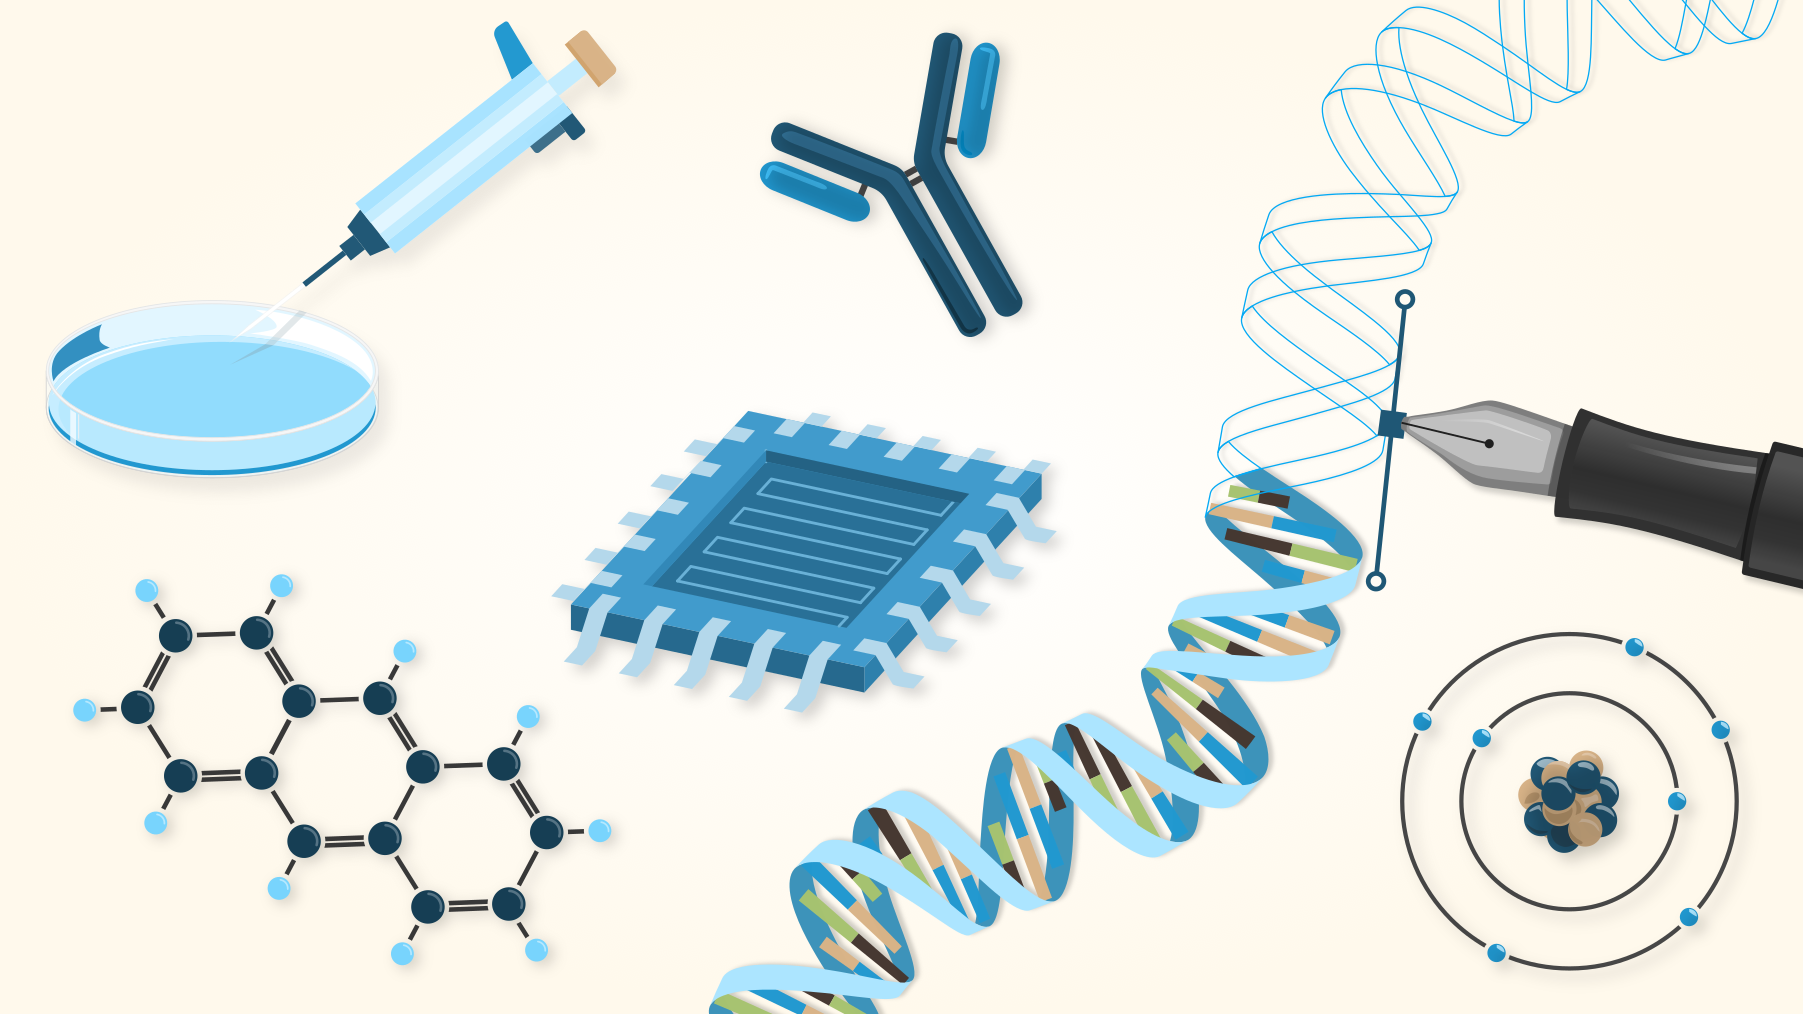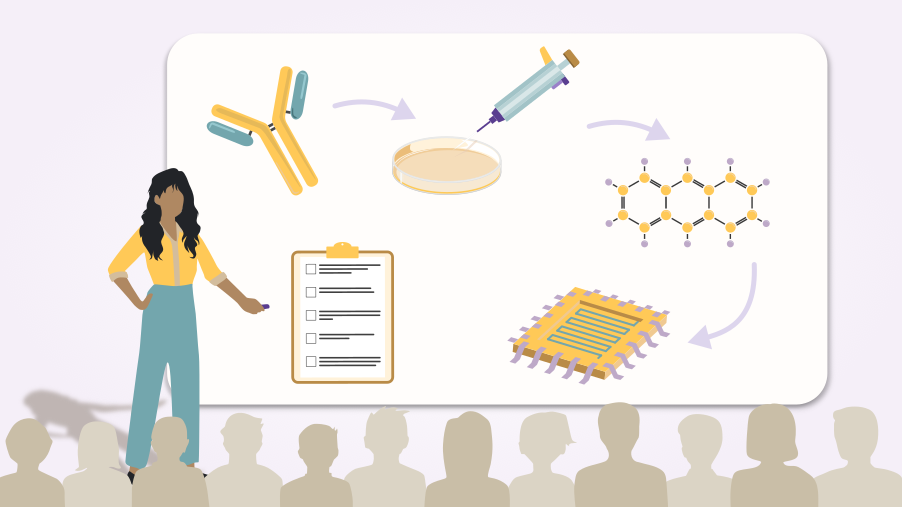
We empower researchers with
visualization skills

5000+
140+
3
2011
Write your awesome label here.
Write your awesome label here.
Write your awesome label here.
Write your awesome label here.
Write your awesome label here.
Write your awesome label here.
Write your awesome label here.
Write your awesome label here.
Write your awesome label here.
Write your awesome label here.
Write your awesome label here.
Write your awesome label here.
Write your awesome label here.
Write your awesome label here.
Write your awesome label here.
Write your awesome label here.
Write your awesome label here.
Write your awesome label here.
Write your awesome label here.
Write your awesome label here.
Write your awesome label here.
Write your awesome label here.
Write your awesome label here.
Write your awesome label here.
Write your awesome label here.
Write your awesome label here.
Write your awesome label here.
Write your awesome label here.
Write your awesome label here.
Write your awesome label here.
Write your awesome label here.
Write your awesome label here.
Write your awesome label here.
Write your awesome label here.
Write your awesome label here.
Write your awesome label here.
Write your awesome label here.
Write your awesome label here.
Write your awesome label here.
Write your awesome label here.
Write your awesome label here.
Write your awesome label here.
Write your awesome label here.
Write your awesome label here.
Write your awesome label here.
Write your awesome label here.
Write your awesome label here.
Write your awesome label here.
Write your awesome label here.
Write your awesome label here.
Write your awesome label here.
Write your awesome label here.
Write your awesome label here.
Write your awesome label here.
Write your awesome label here.
Write your awesome label here.
Write your awesome label here.
Write your awesome label here.
Write your awesome label here.
Write your awesome label here.
Write your awesome label here.
Write your awesome label here.
Write your awesome label here.
Write your awesome label here.
Write your awesome label here.
Write your awesome label here.
Write your awesome label here.
Write your awesome label here.
Write your awesome label here.
Write your awesome label here.
Write your awesome label here.
Write your awesome label here.
Write your awesome label here.
Write your awesome label here.
Write your awesome label here.
Write your awesome label here.
Write your awesome label here.
Write your awesome label here.
Write your awesome label here.
Write your awesome label here.
Write your awesome label here.
Write your awesome label here.
Write your awesome label here.
Write your awesome label here.
Write your awesome label here.
Write your awesome label here.
Write your awesome label here.
Write your awesome label here.
Write your awesome label here.
Write your awesome label here.
Write your awesome label here.
Write your awesome label here.
Write your awesome label here.
Write your awesome label here.
Write your awesome label here.
Write your awesome label here.
Write your awesome label here.
Write your awesome label here.
Write your awesome label here.
Write your awesome label here.
Write your awesome label here.
Write your awesome label here.
Write your awesome label here.
Write your awesome label here.
Write your awesome label here.
Write your awesome label here.
Write your awesome label here.
Write your awesome label here.
and many more...!
Student-made journal covers on display!
What students say about our courses
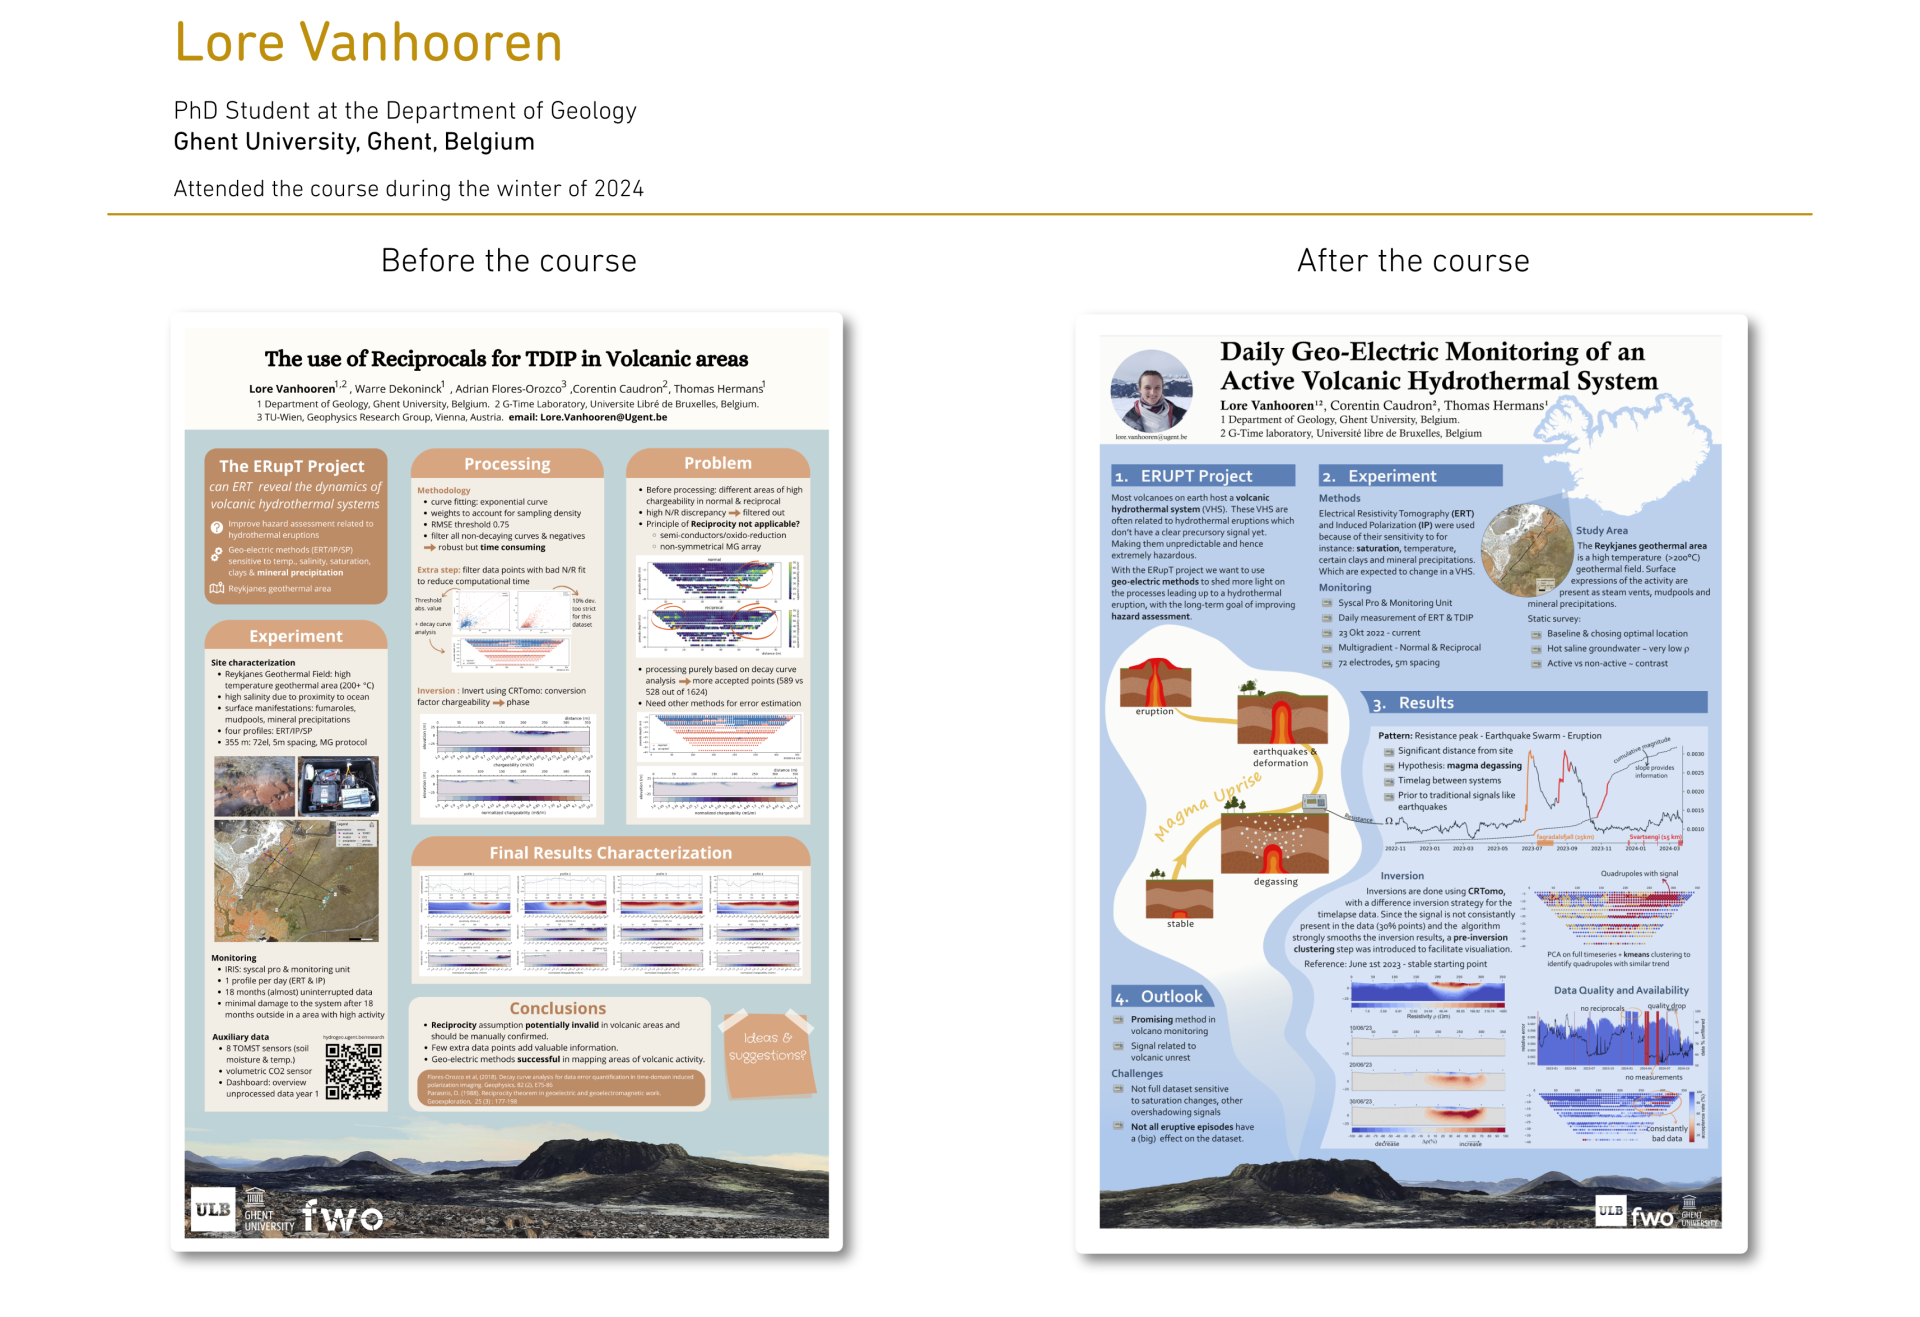
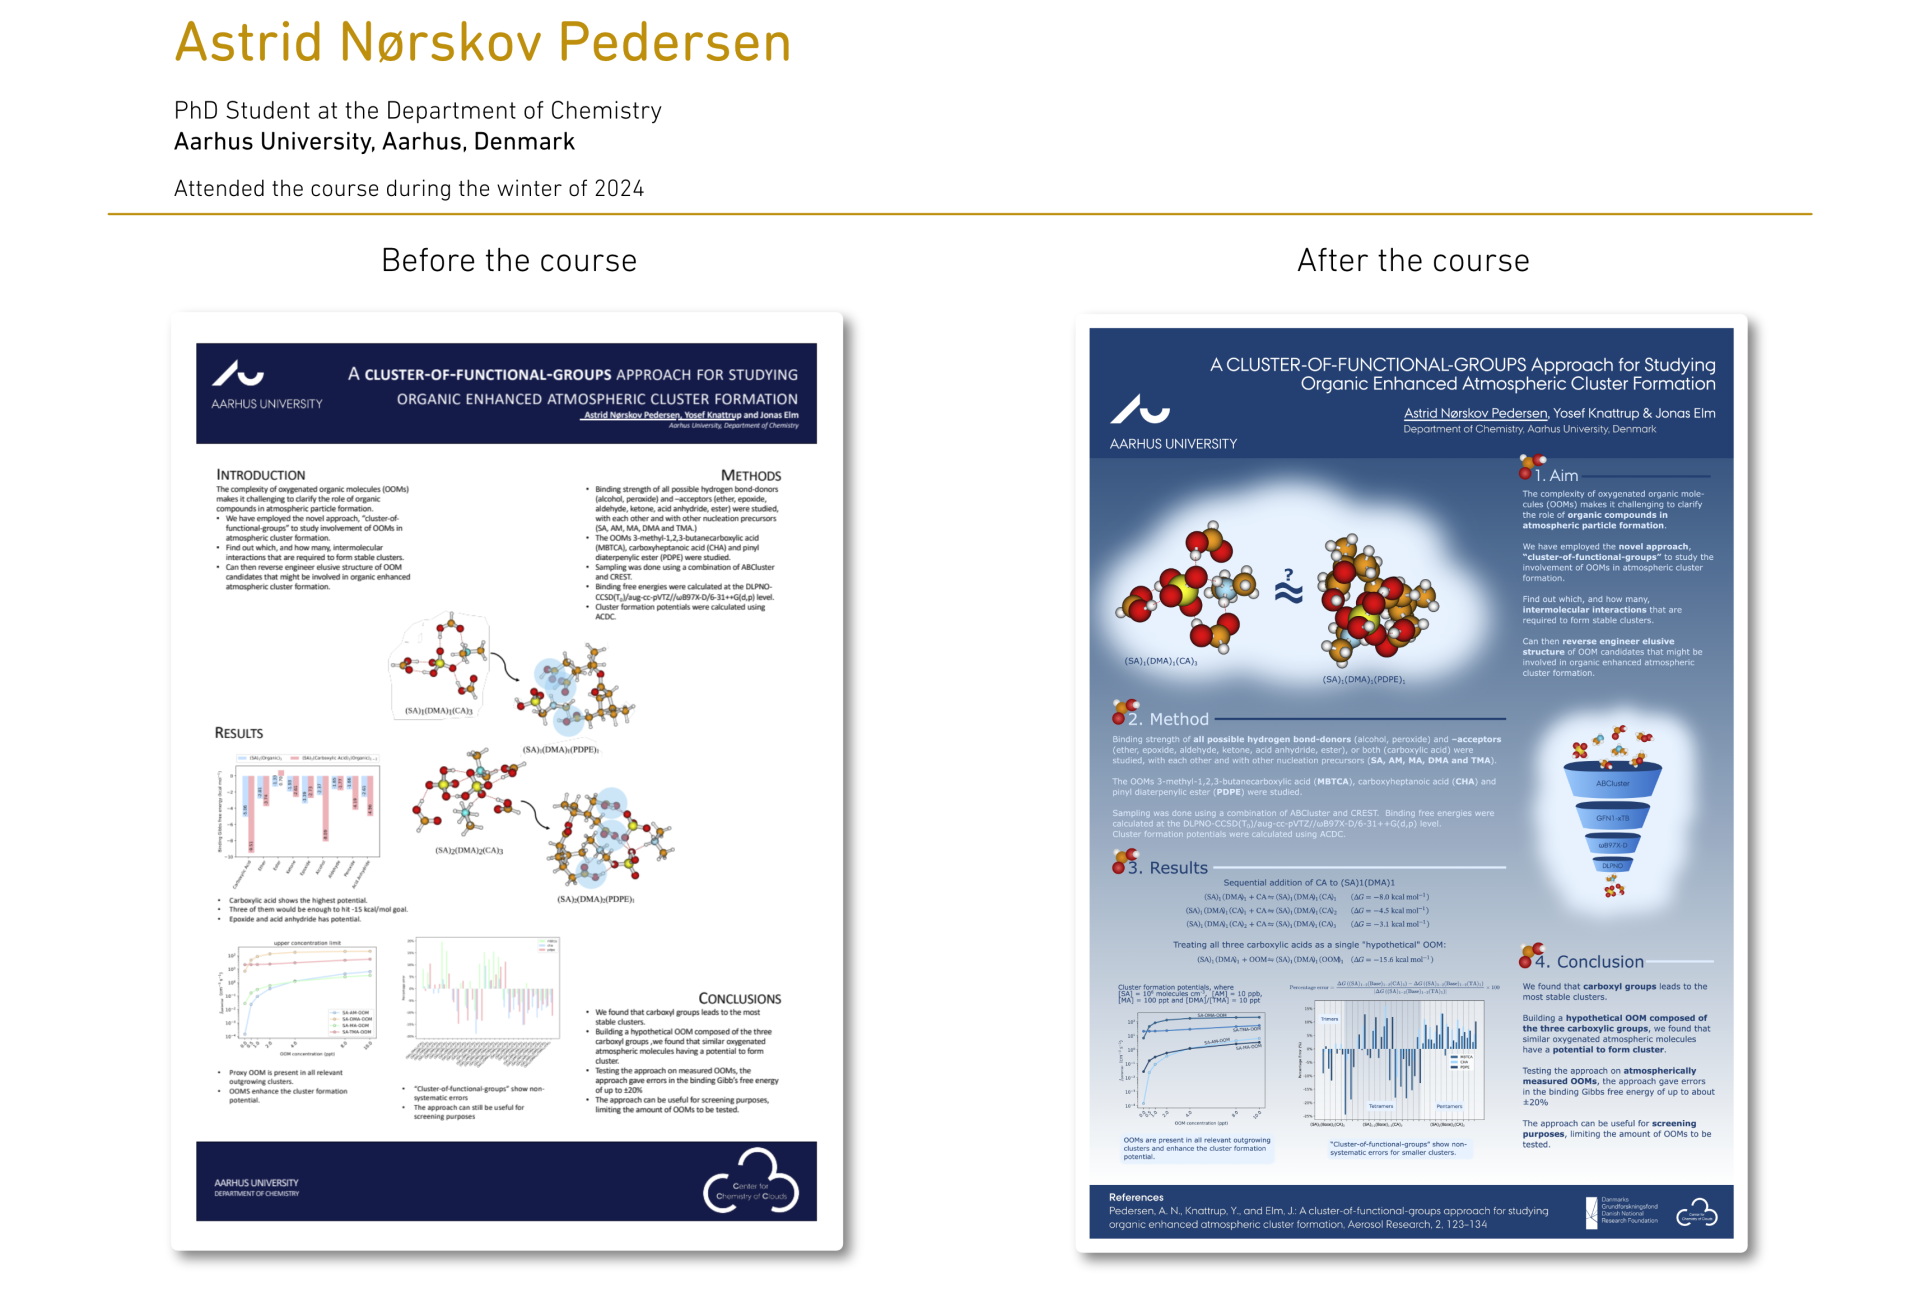
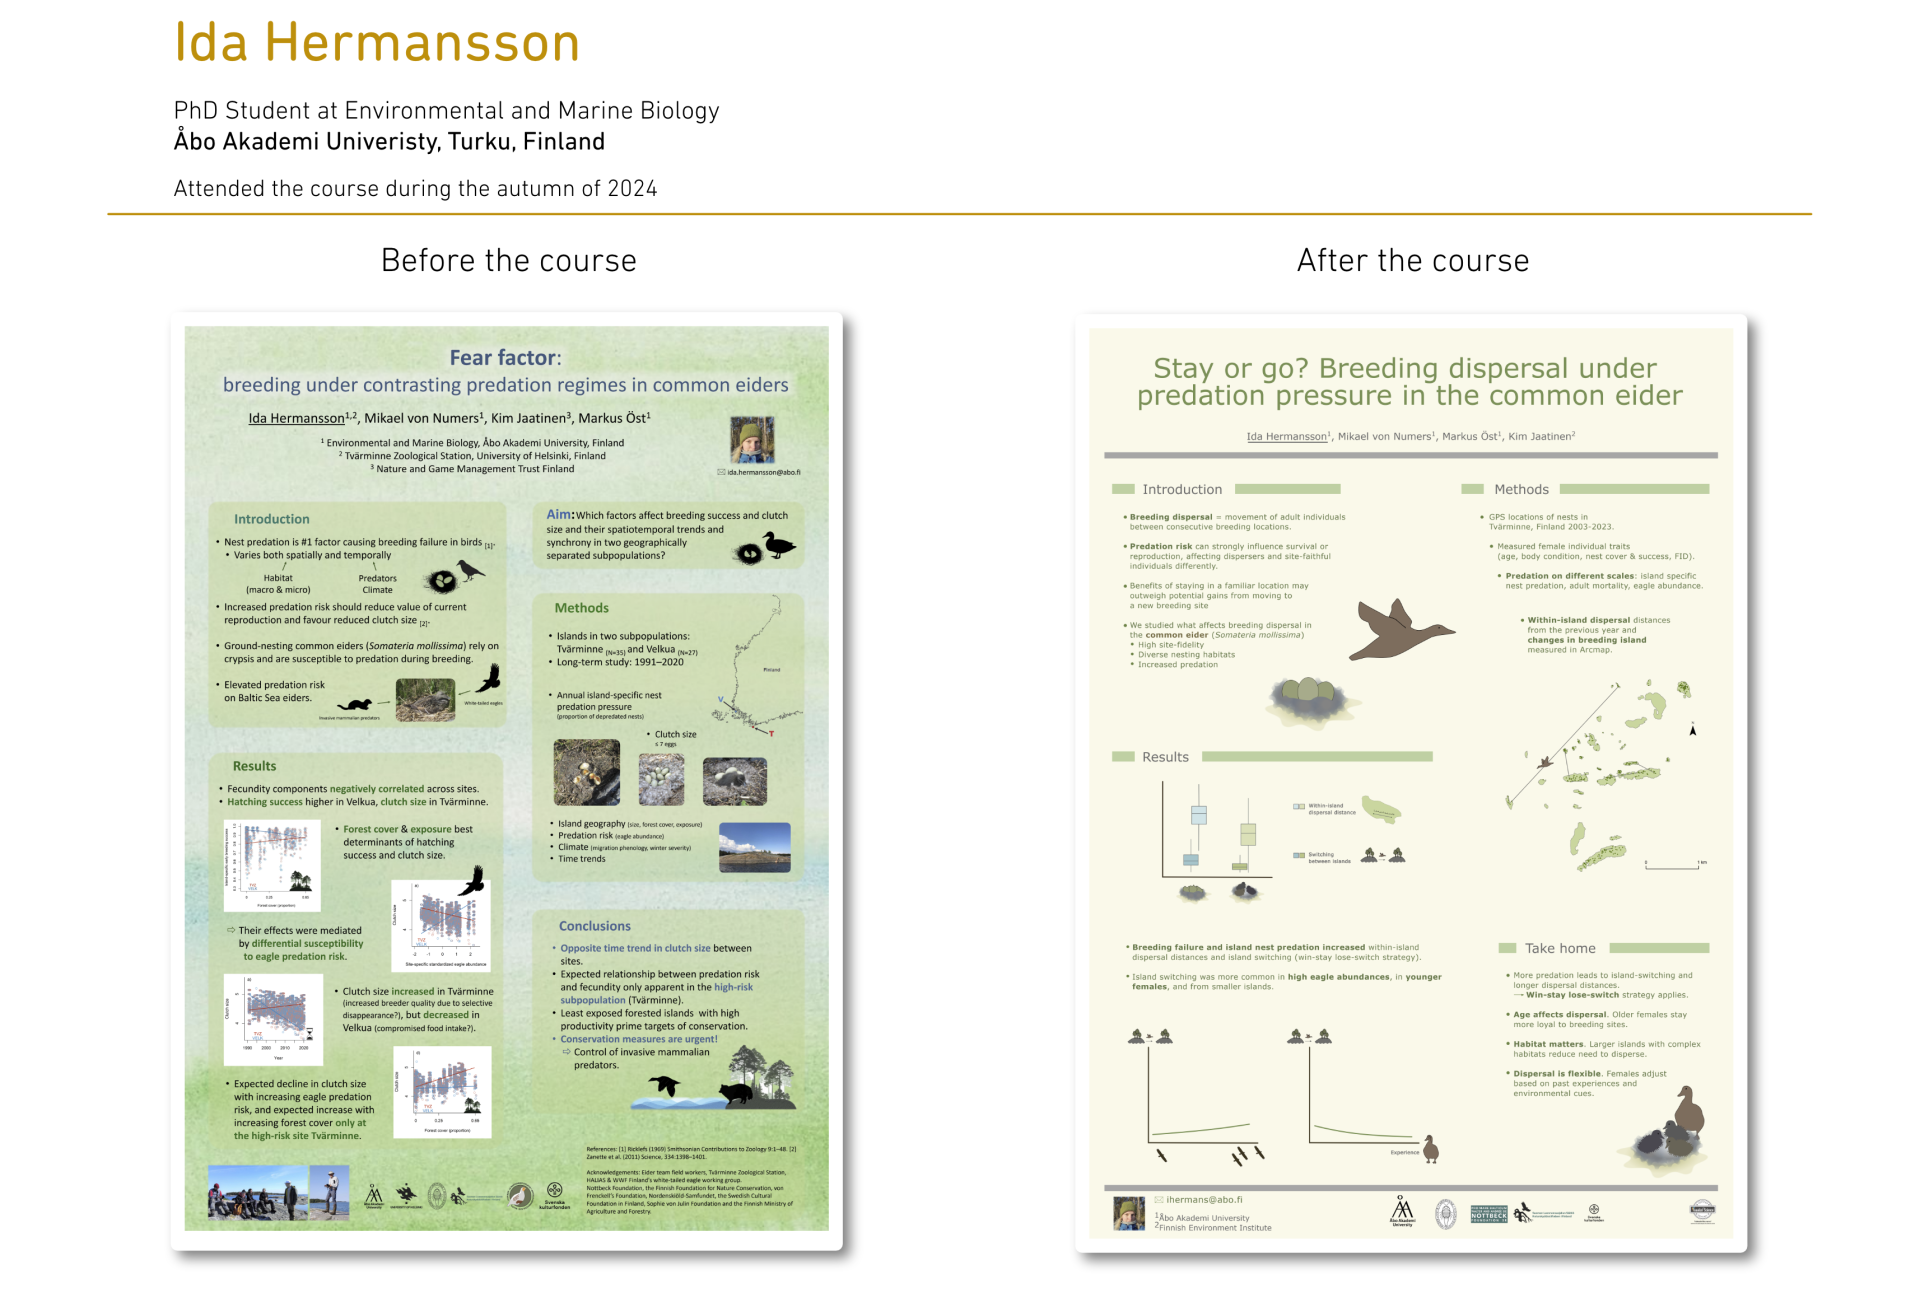
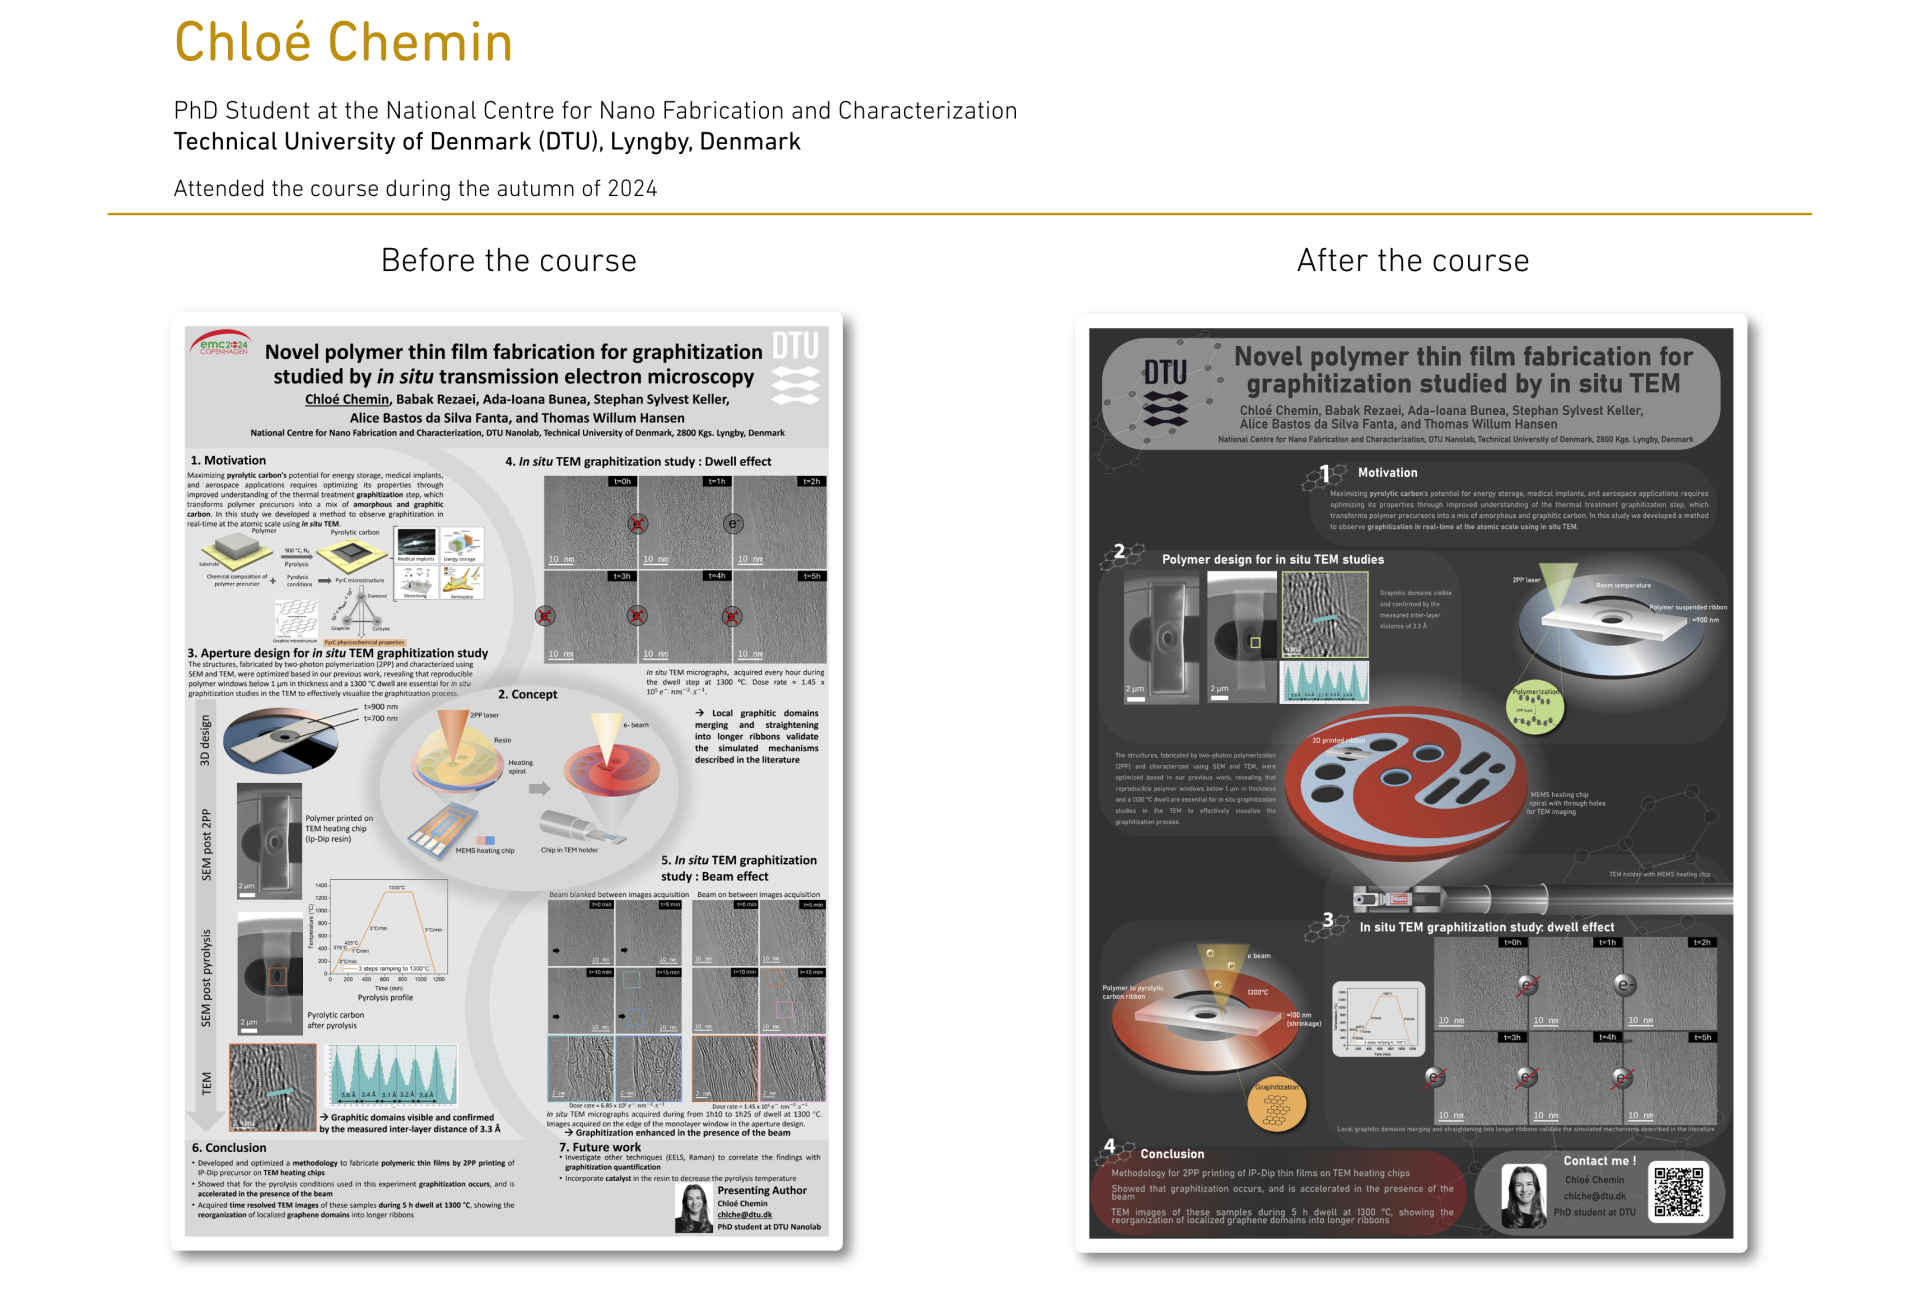
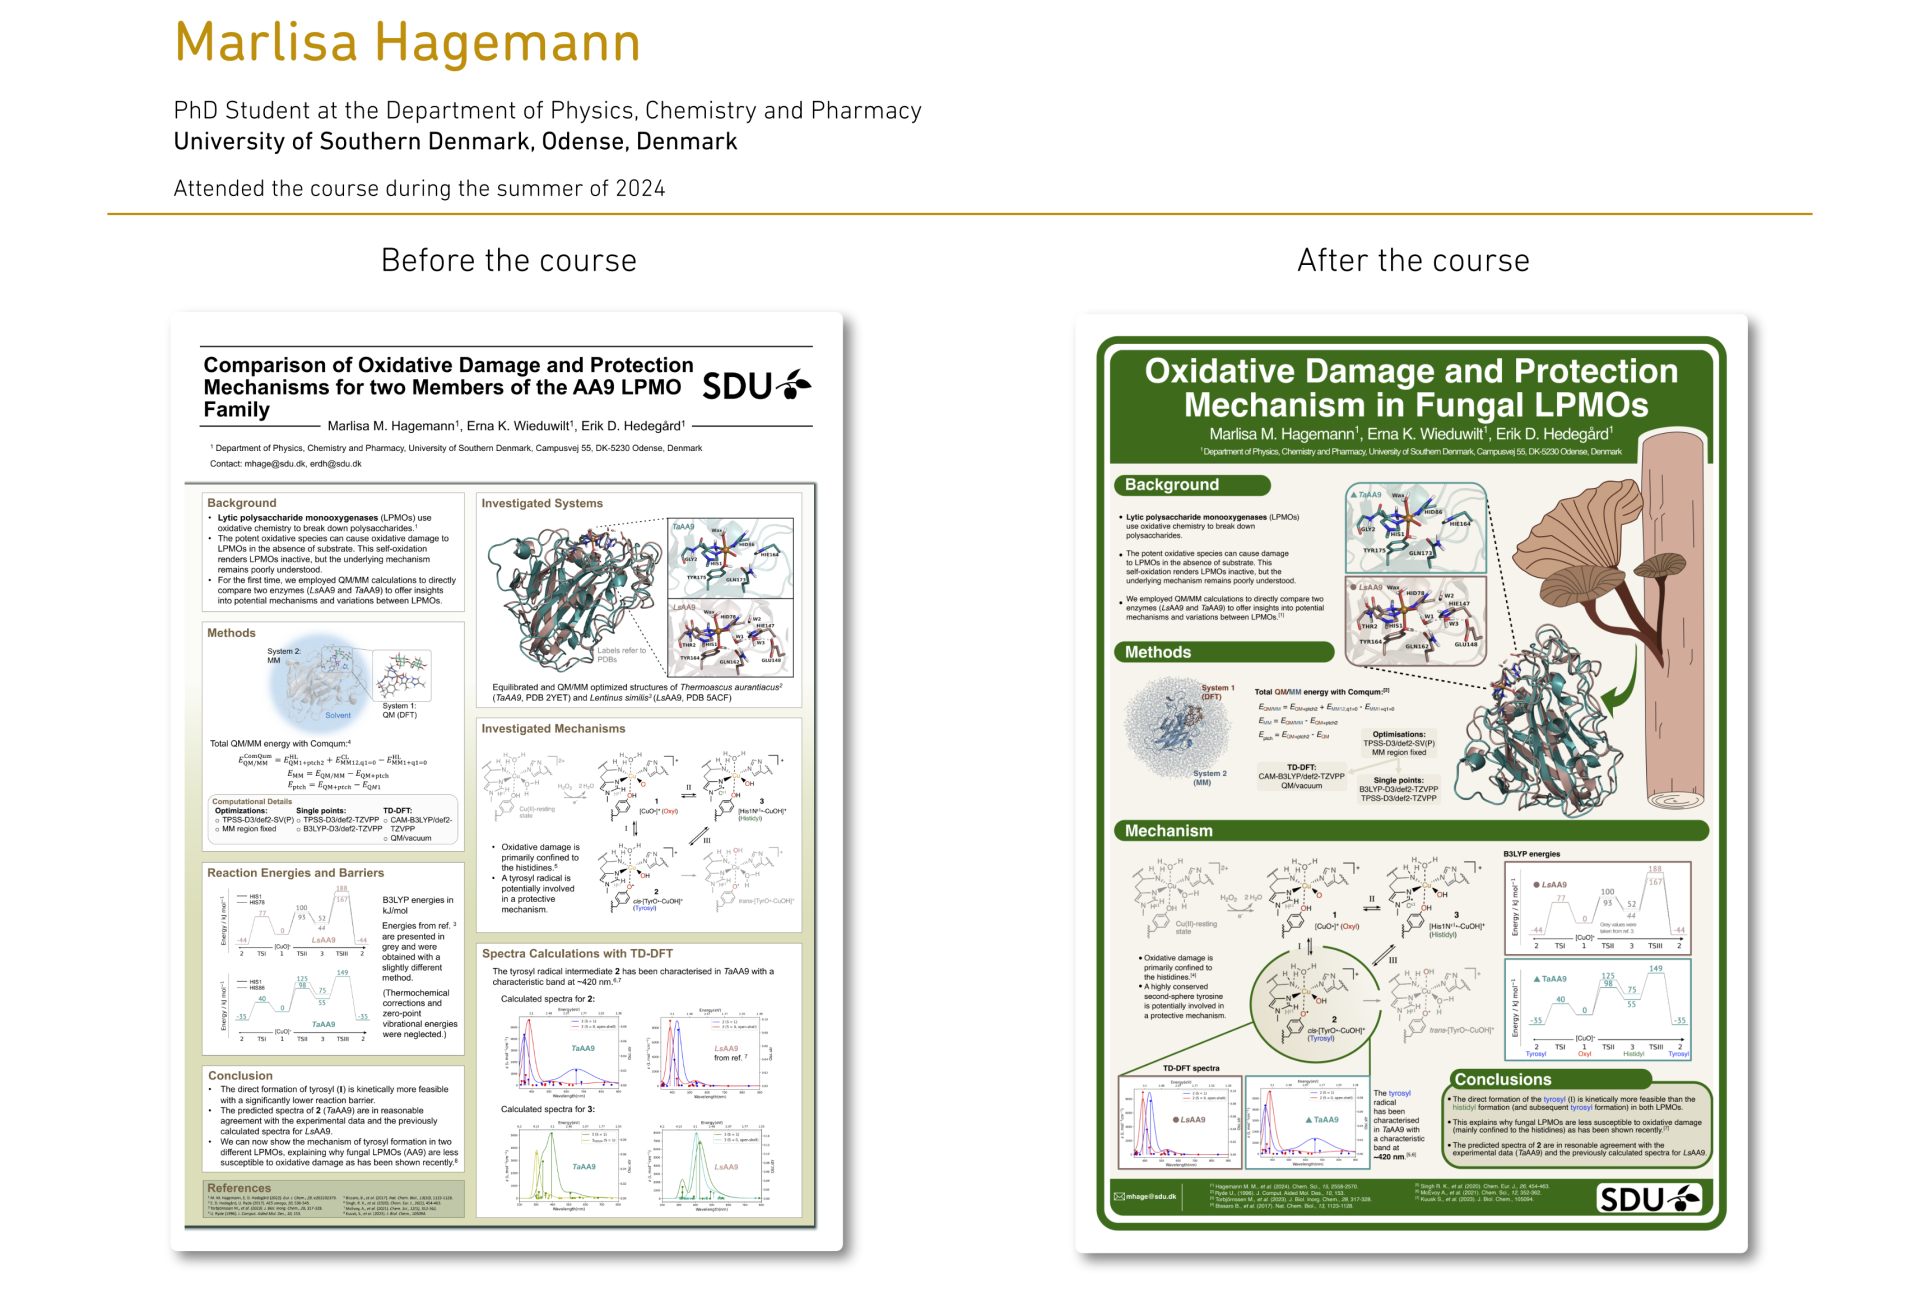
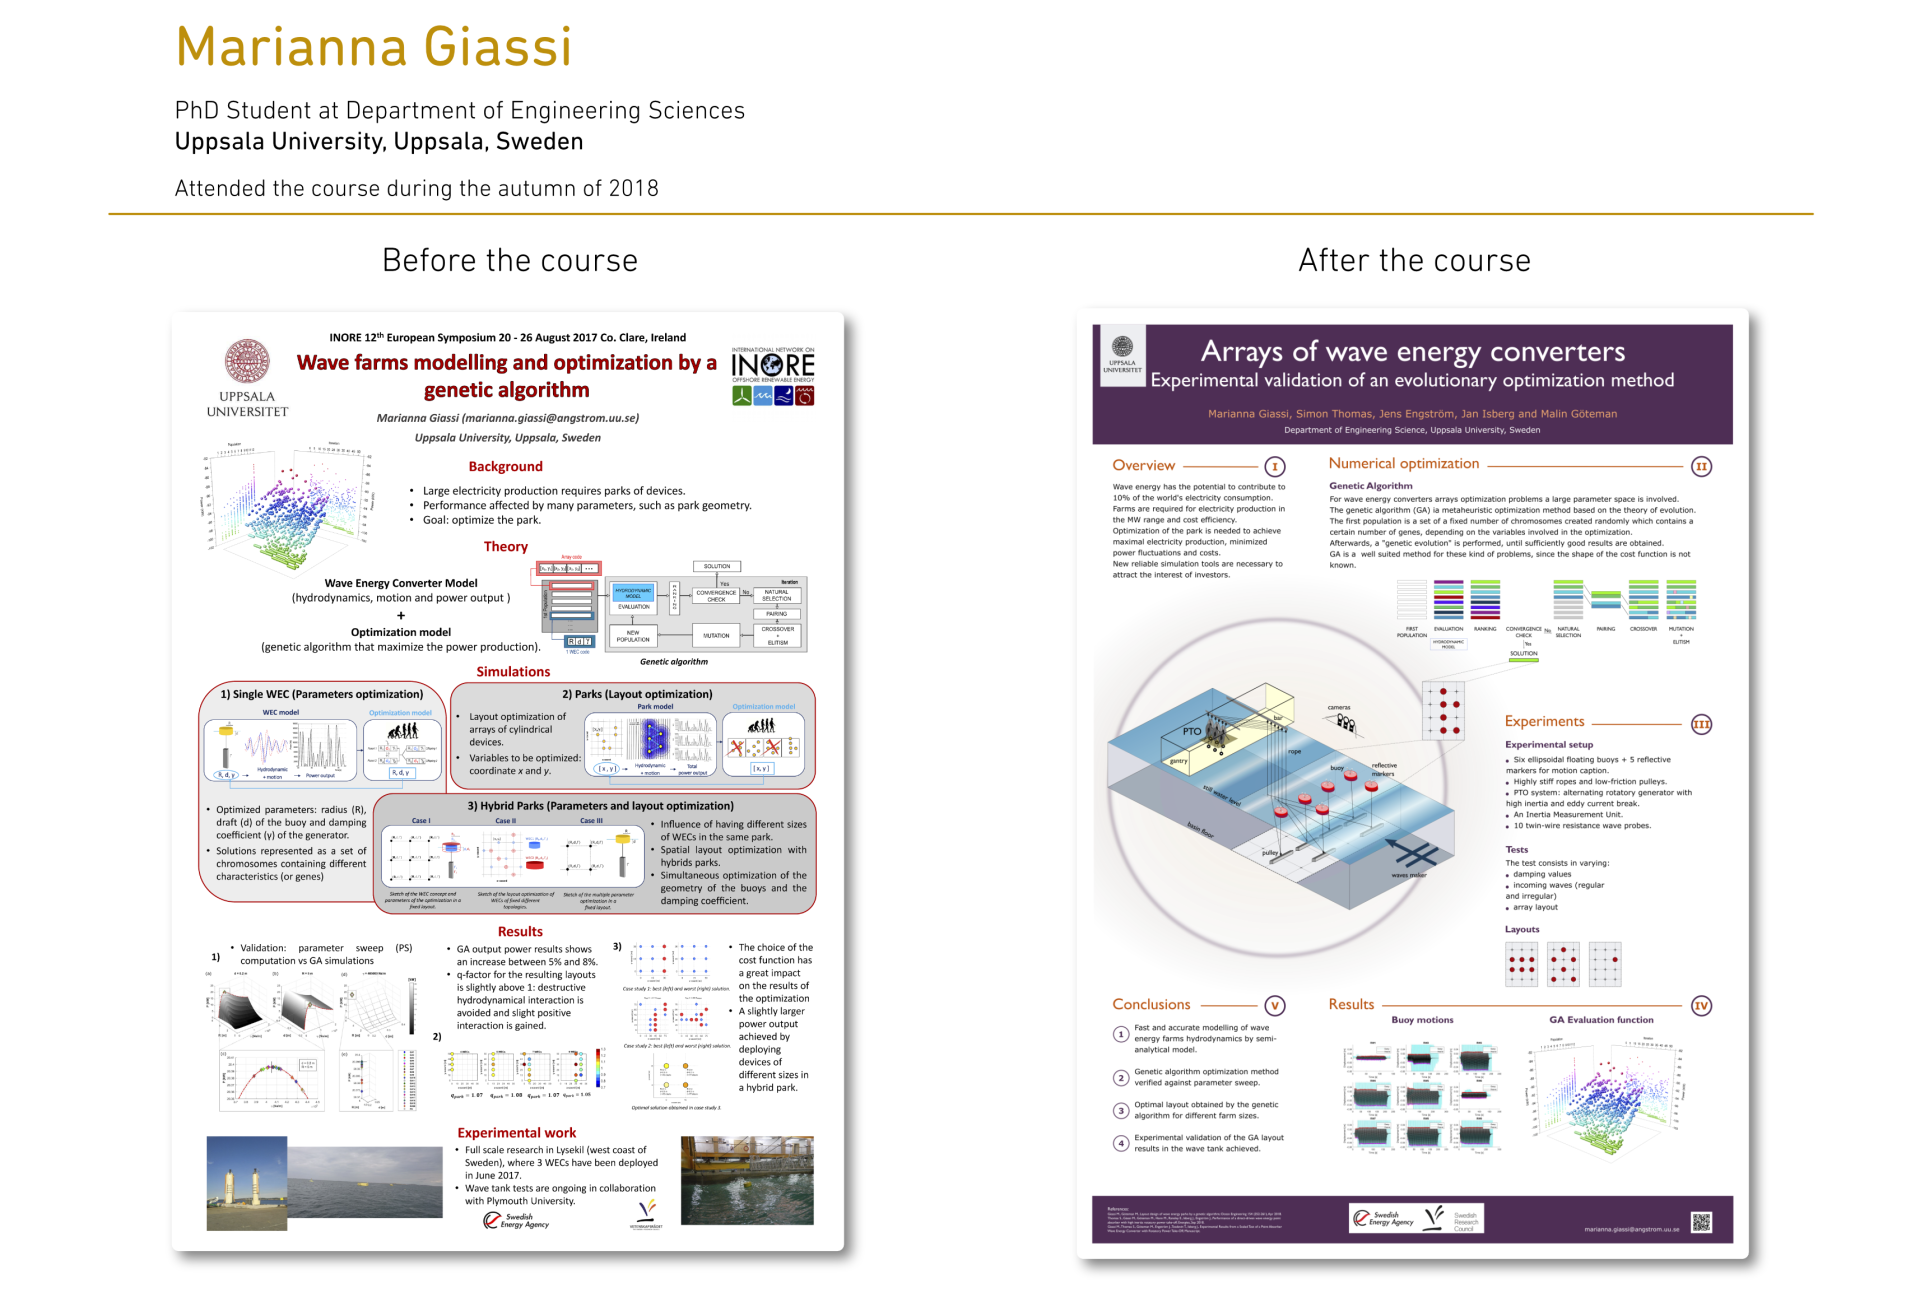
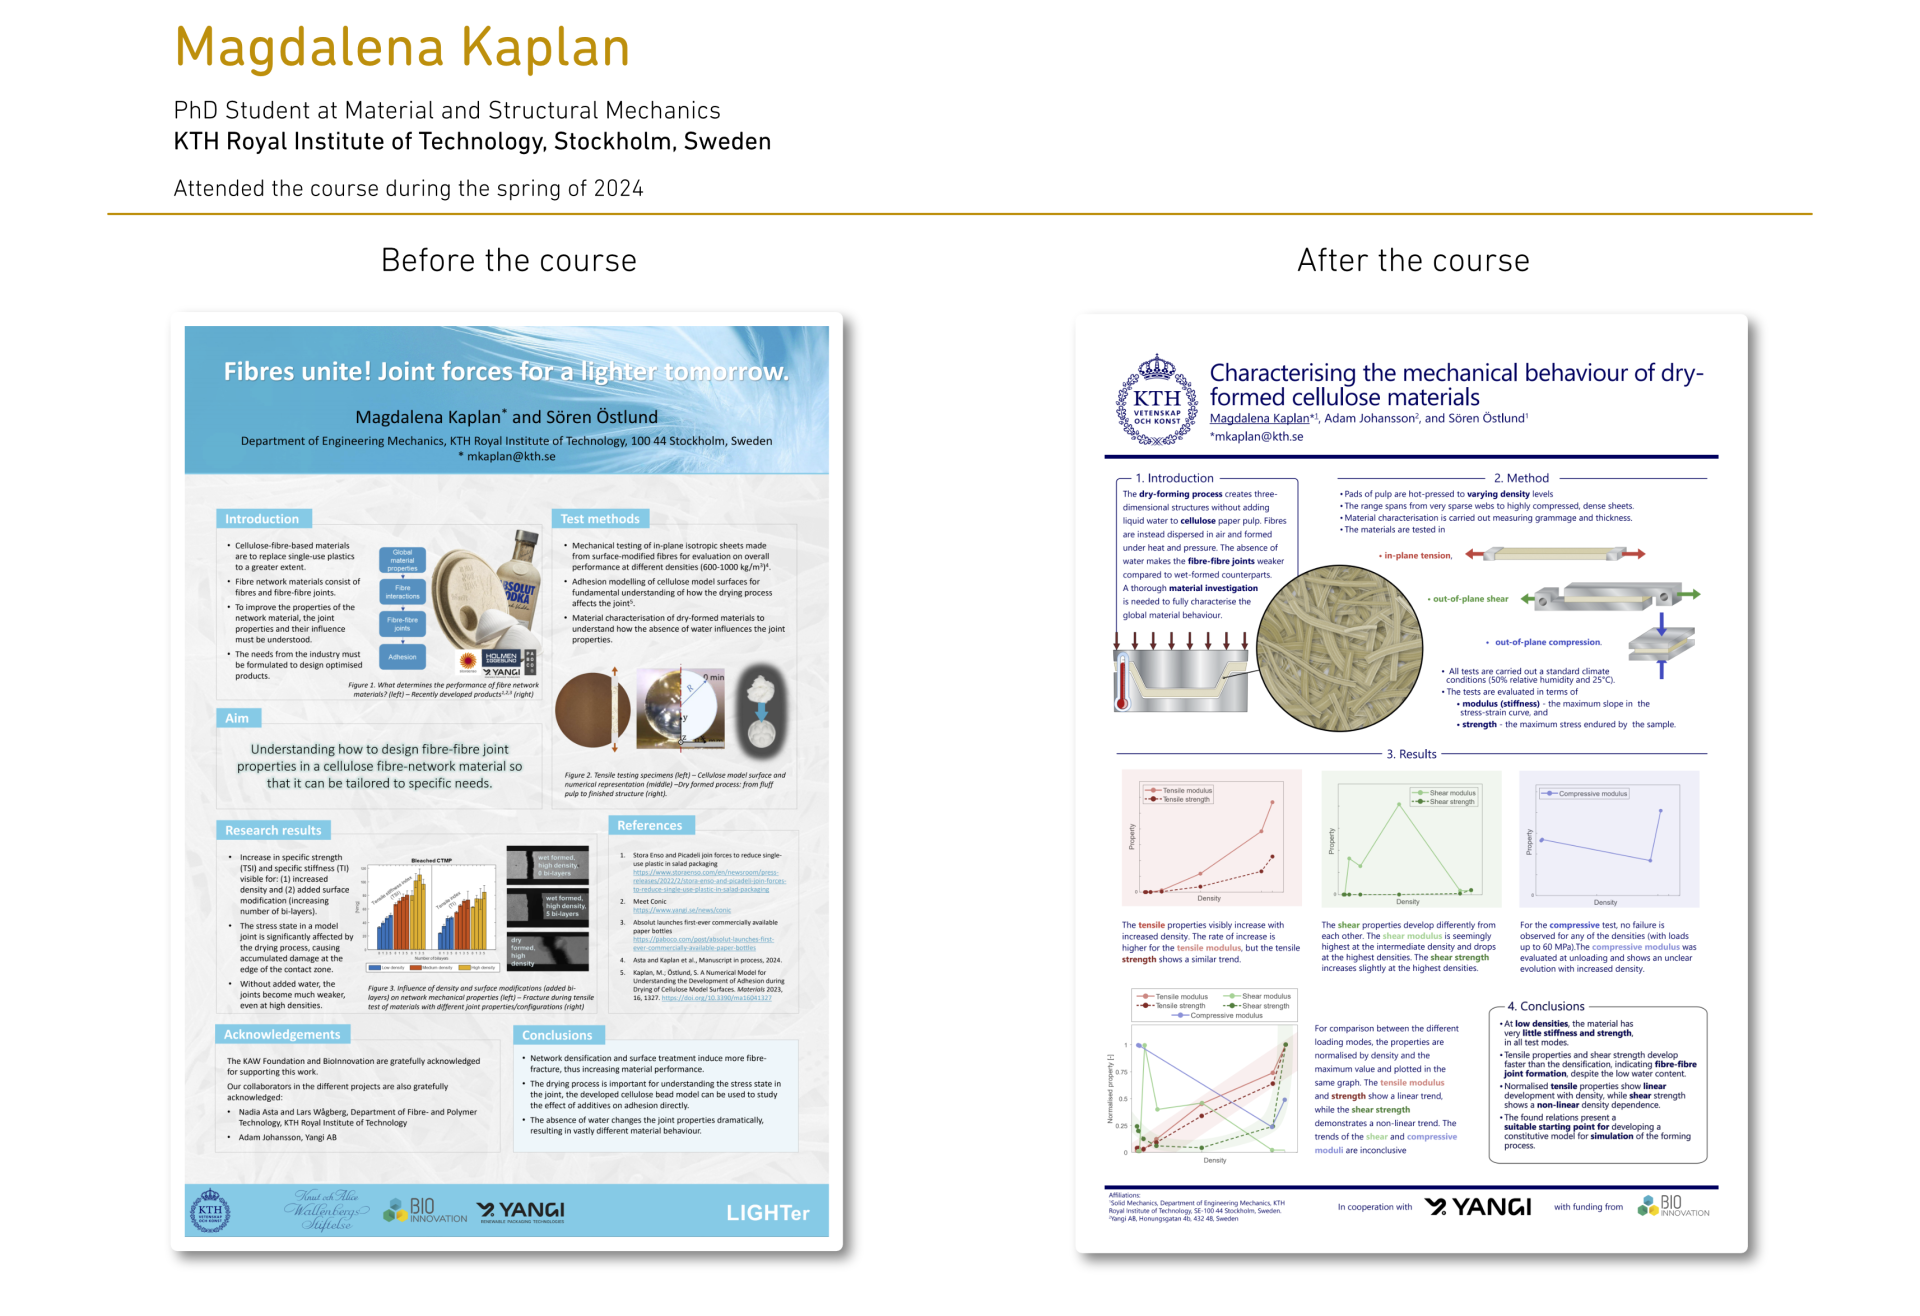
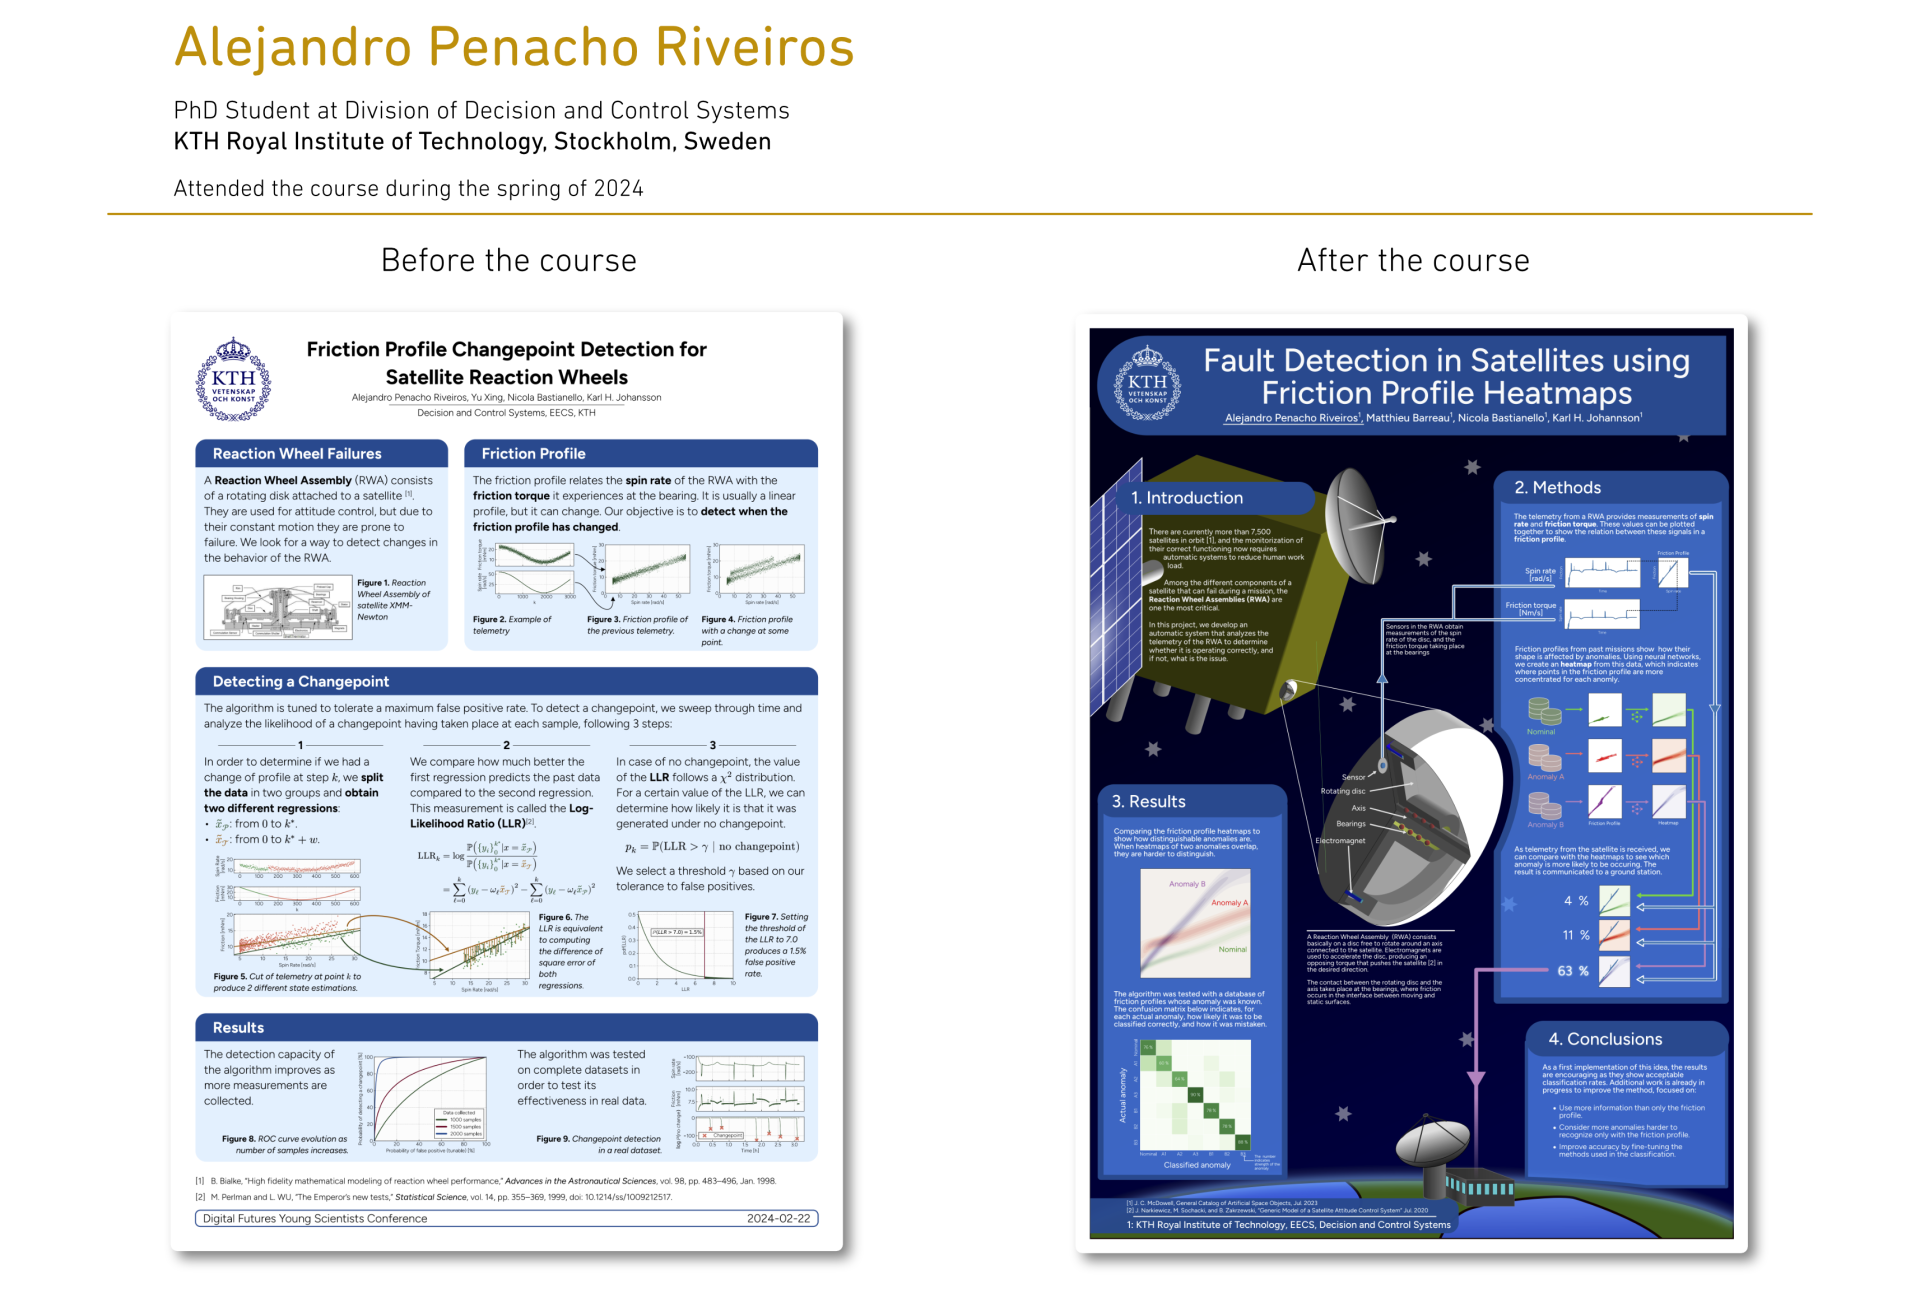
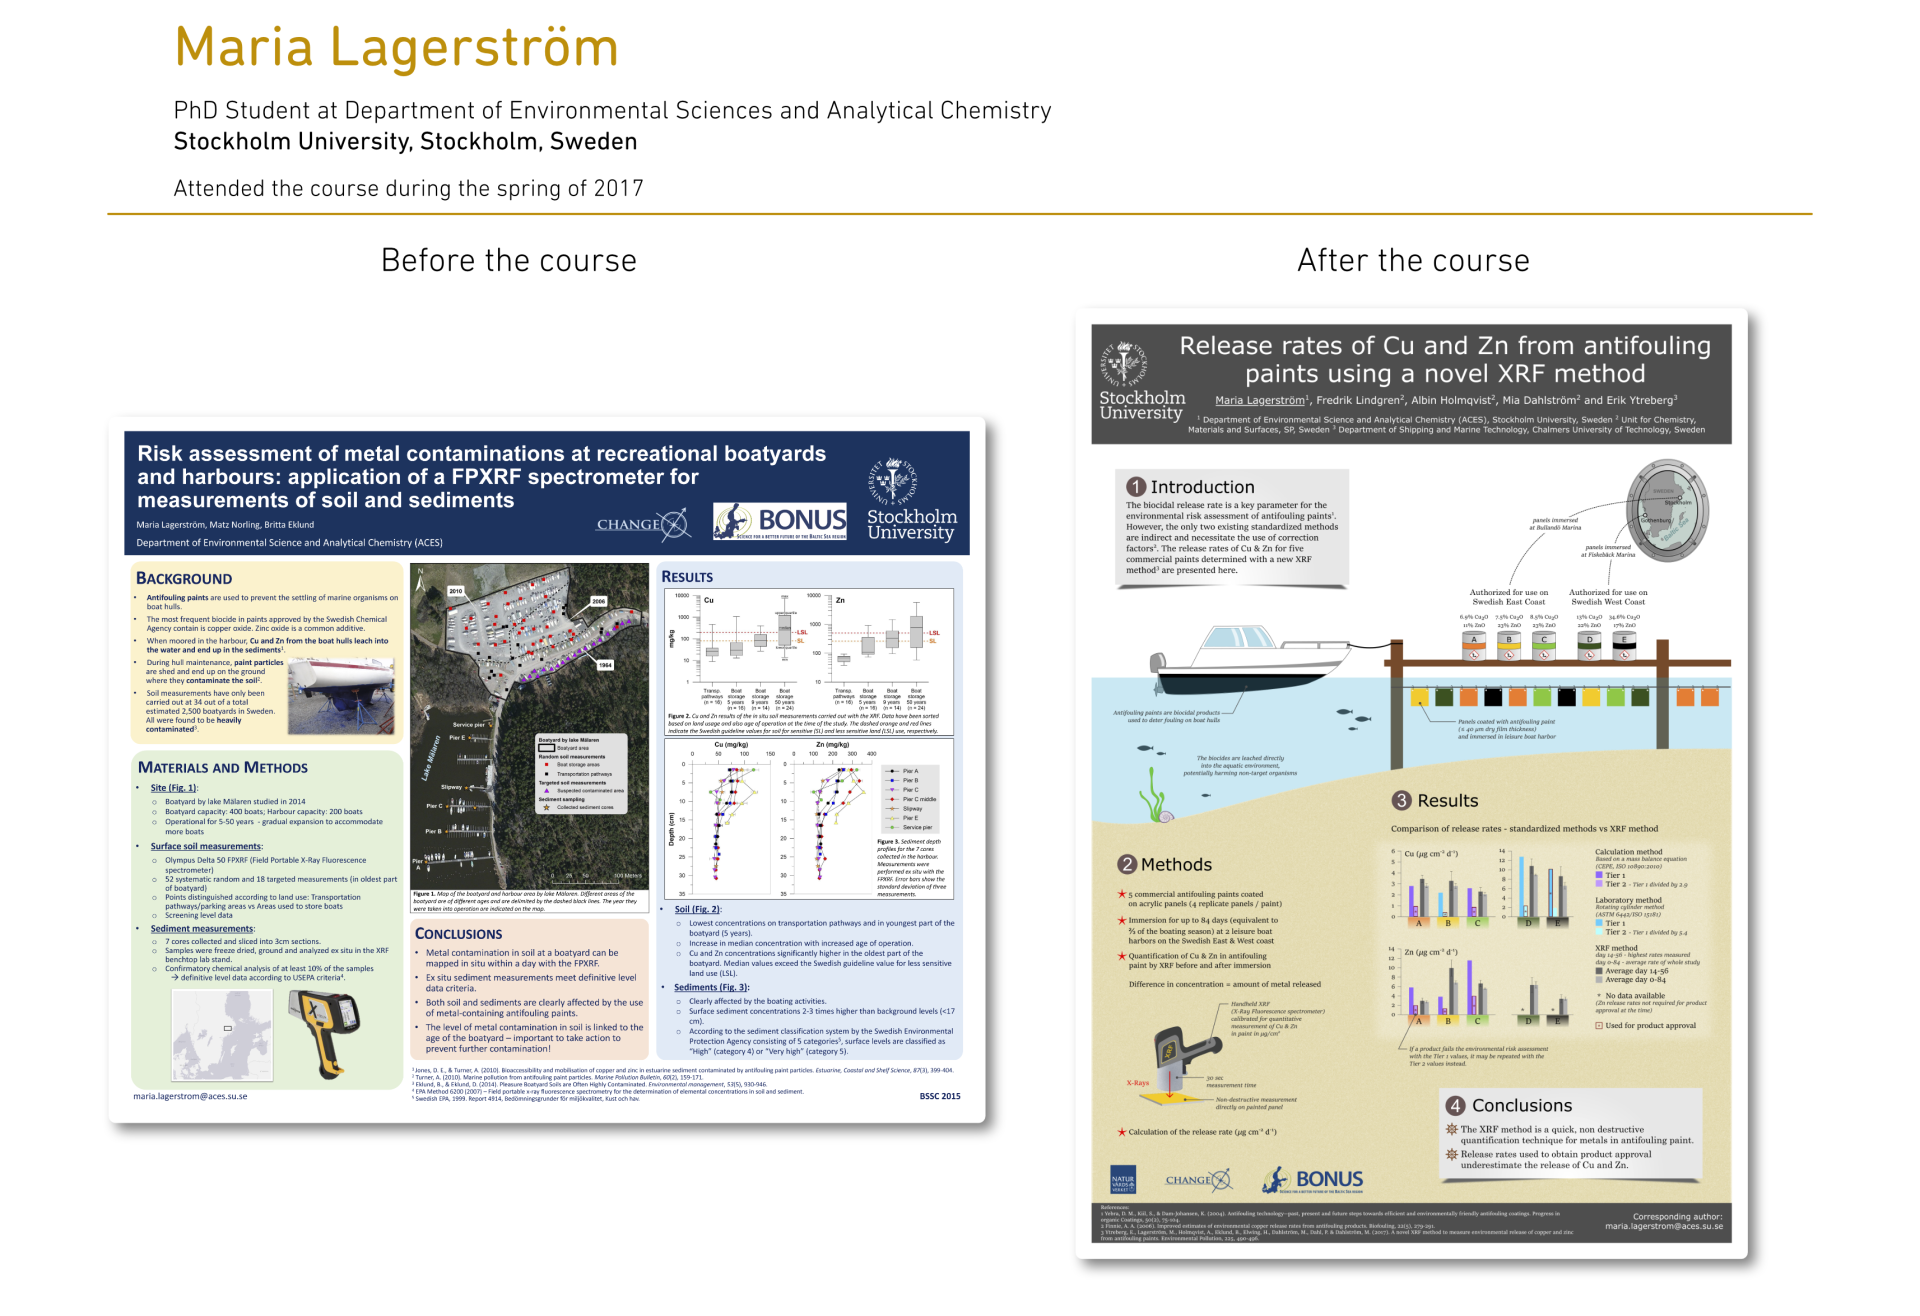
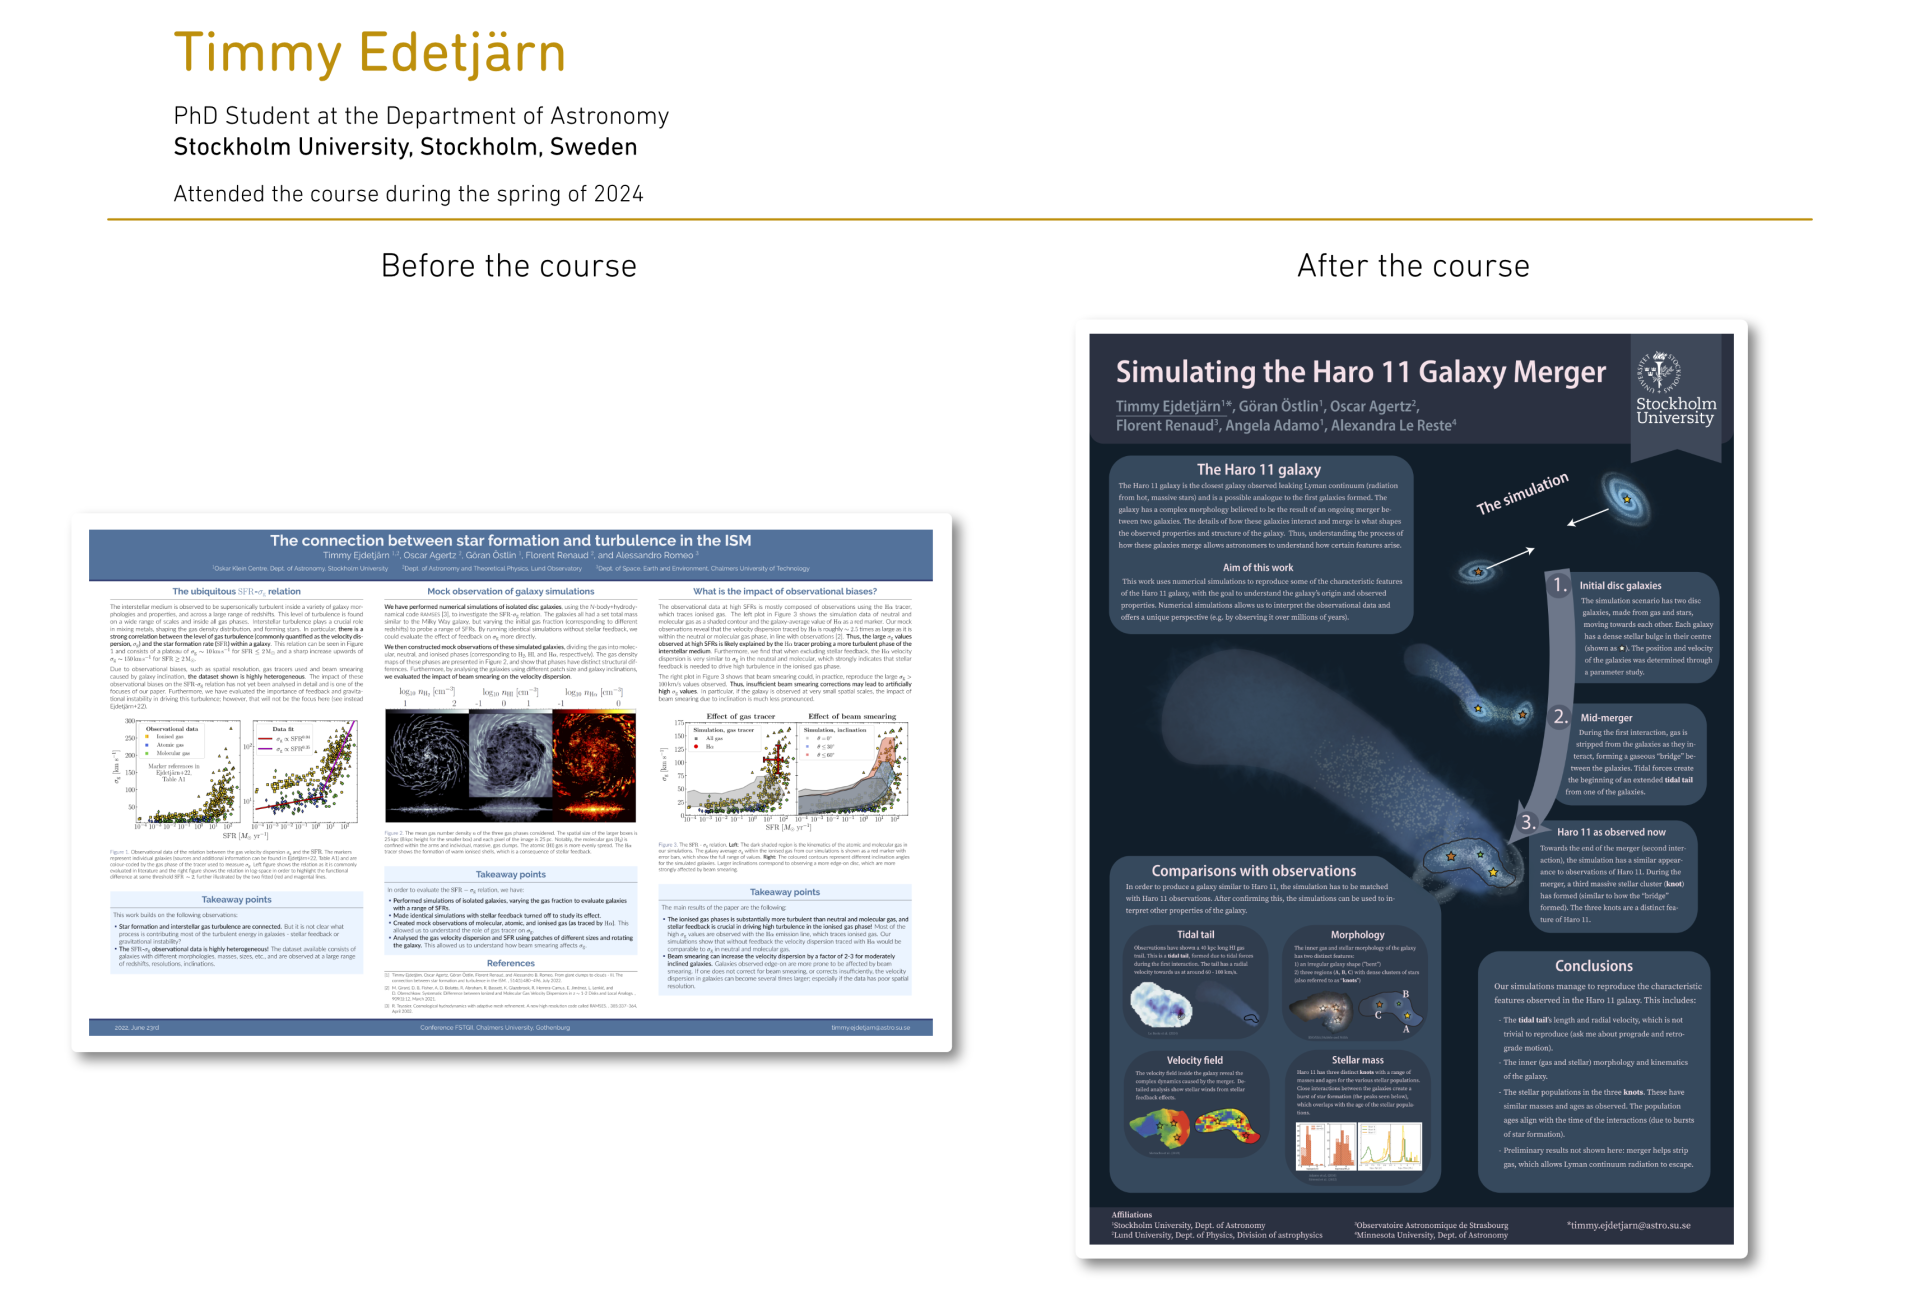
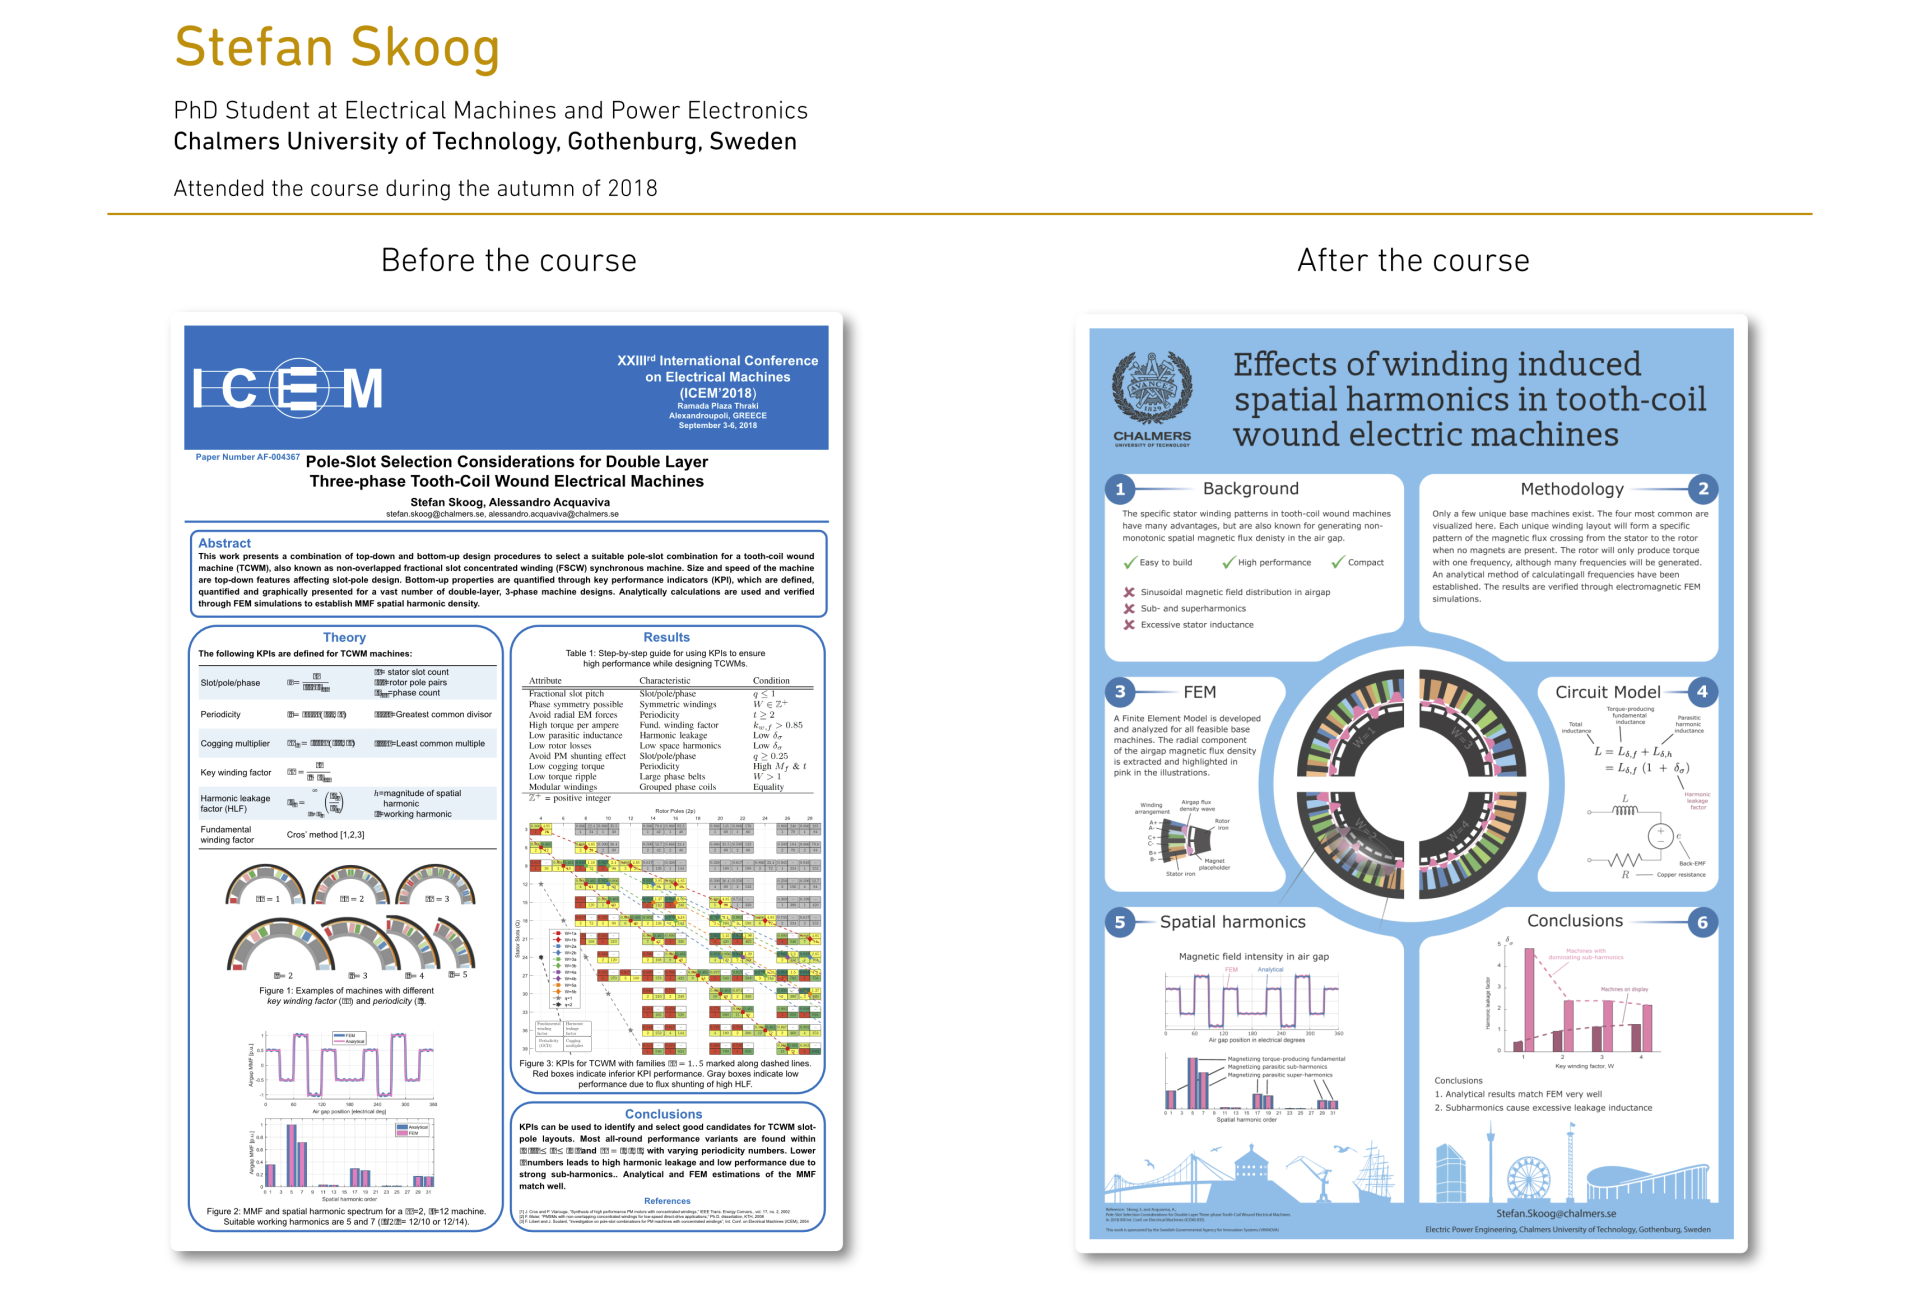
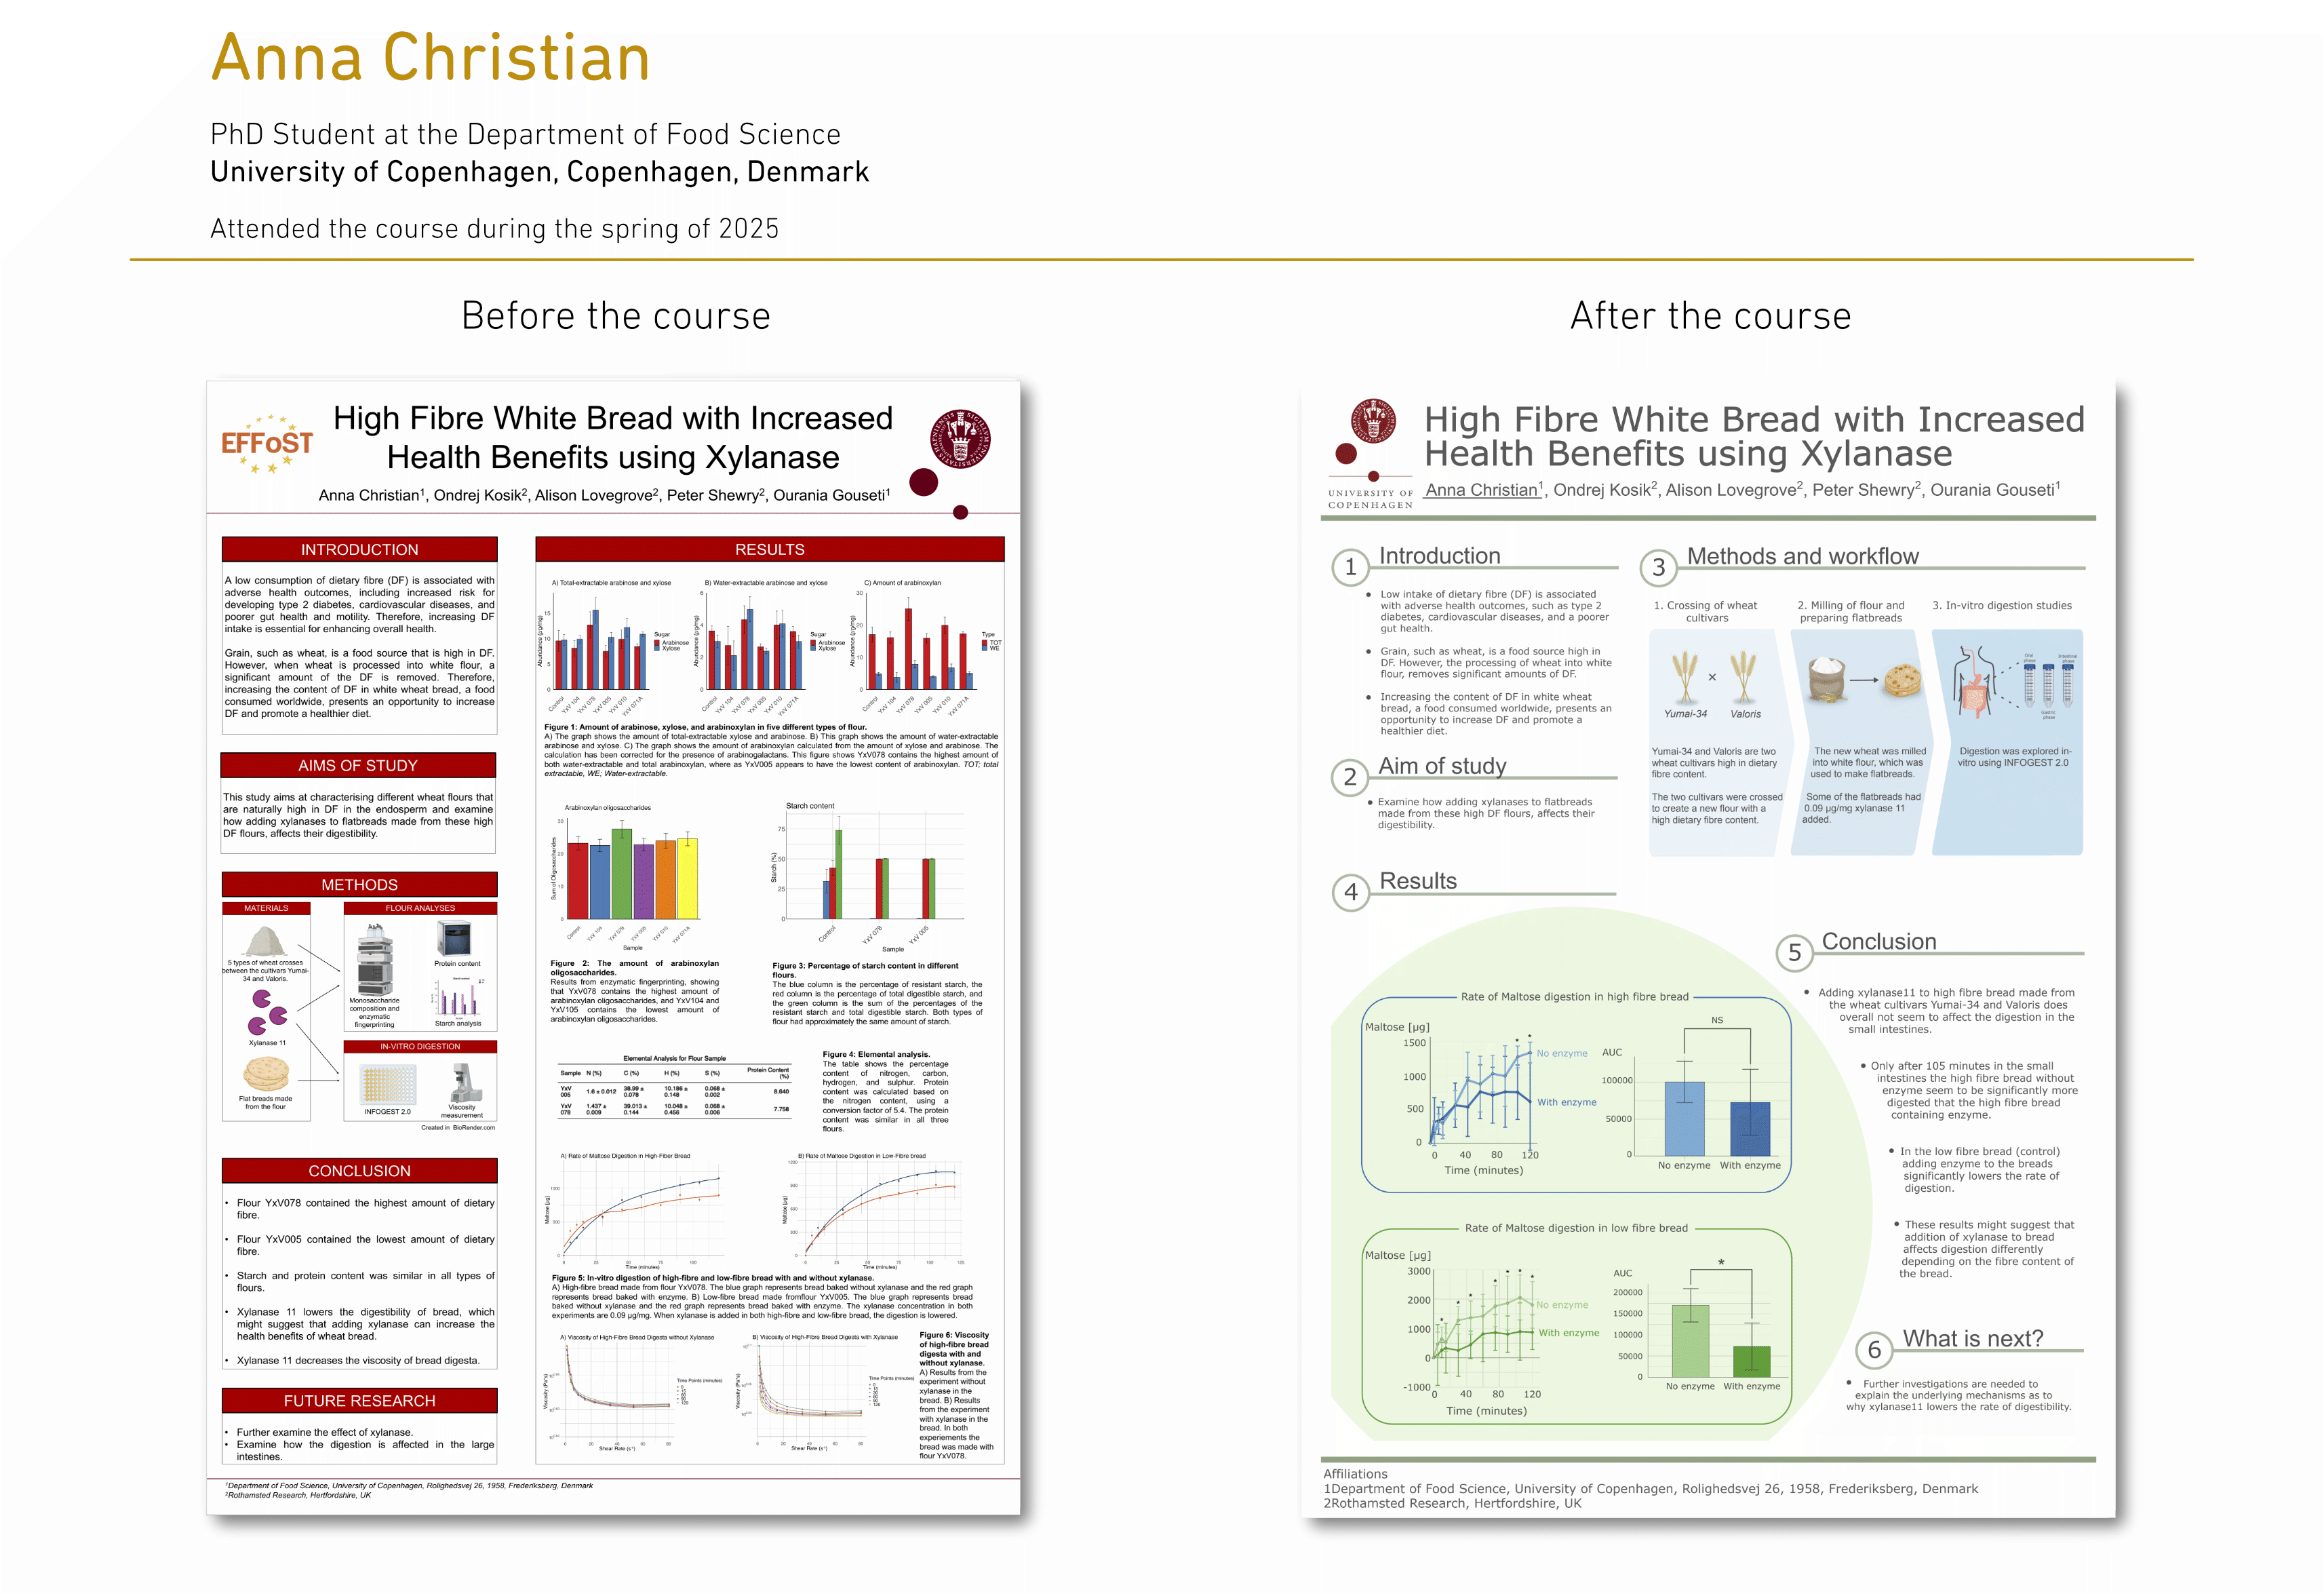
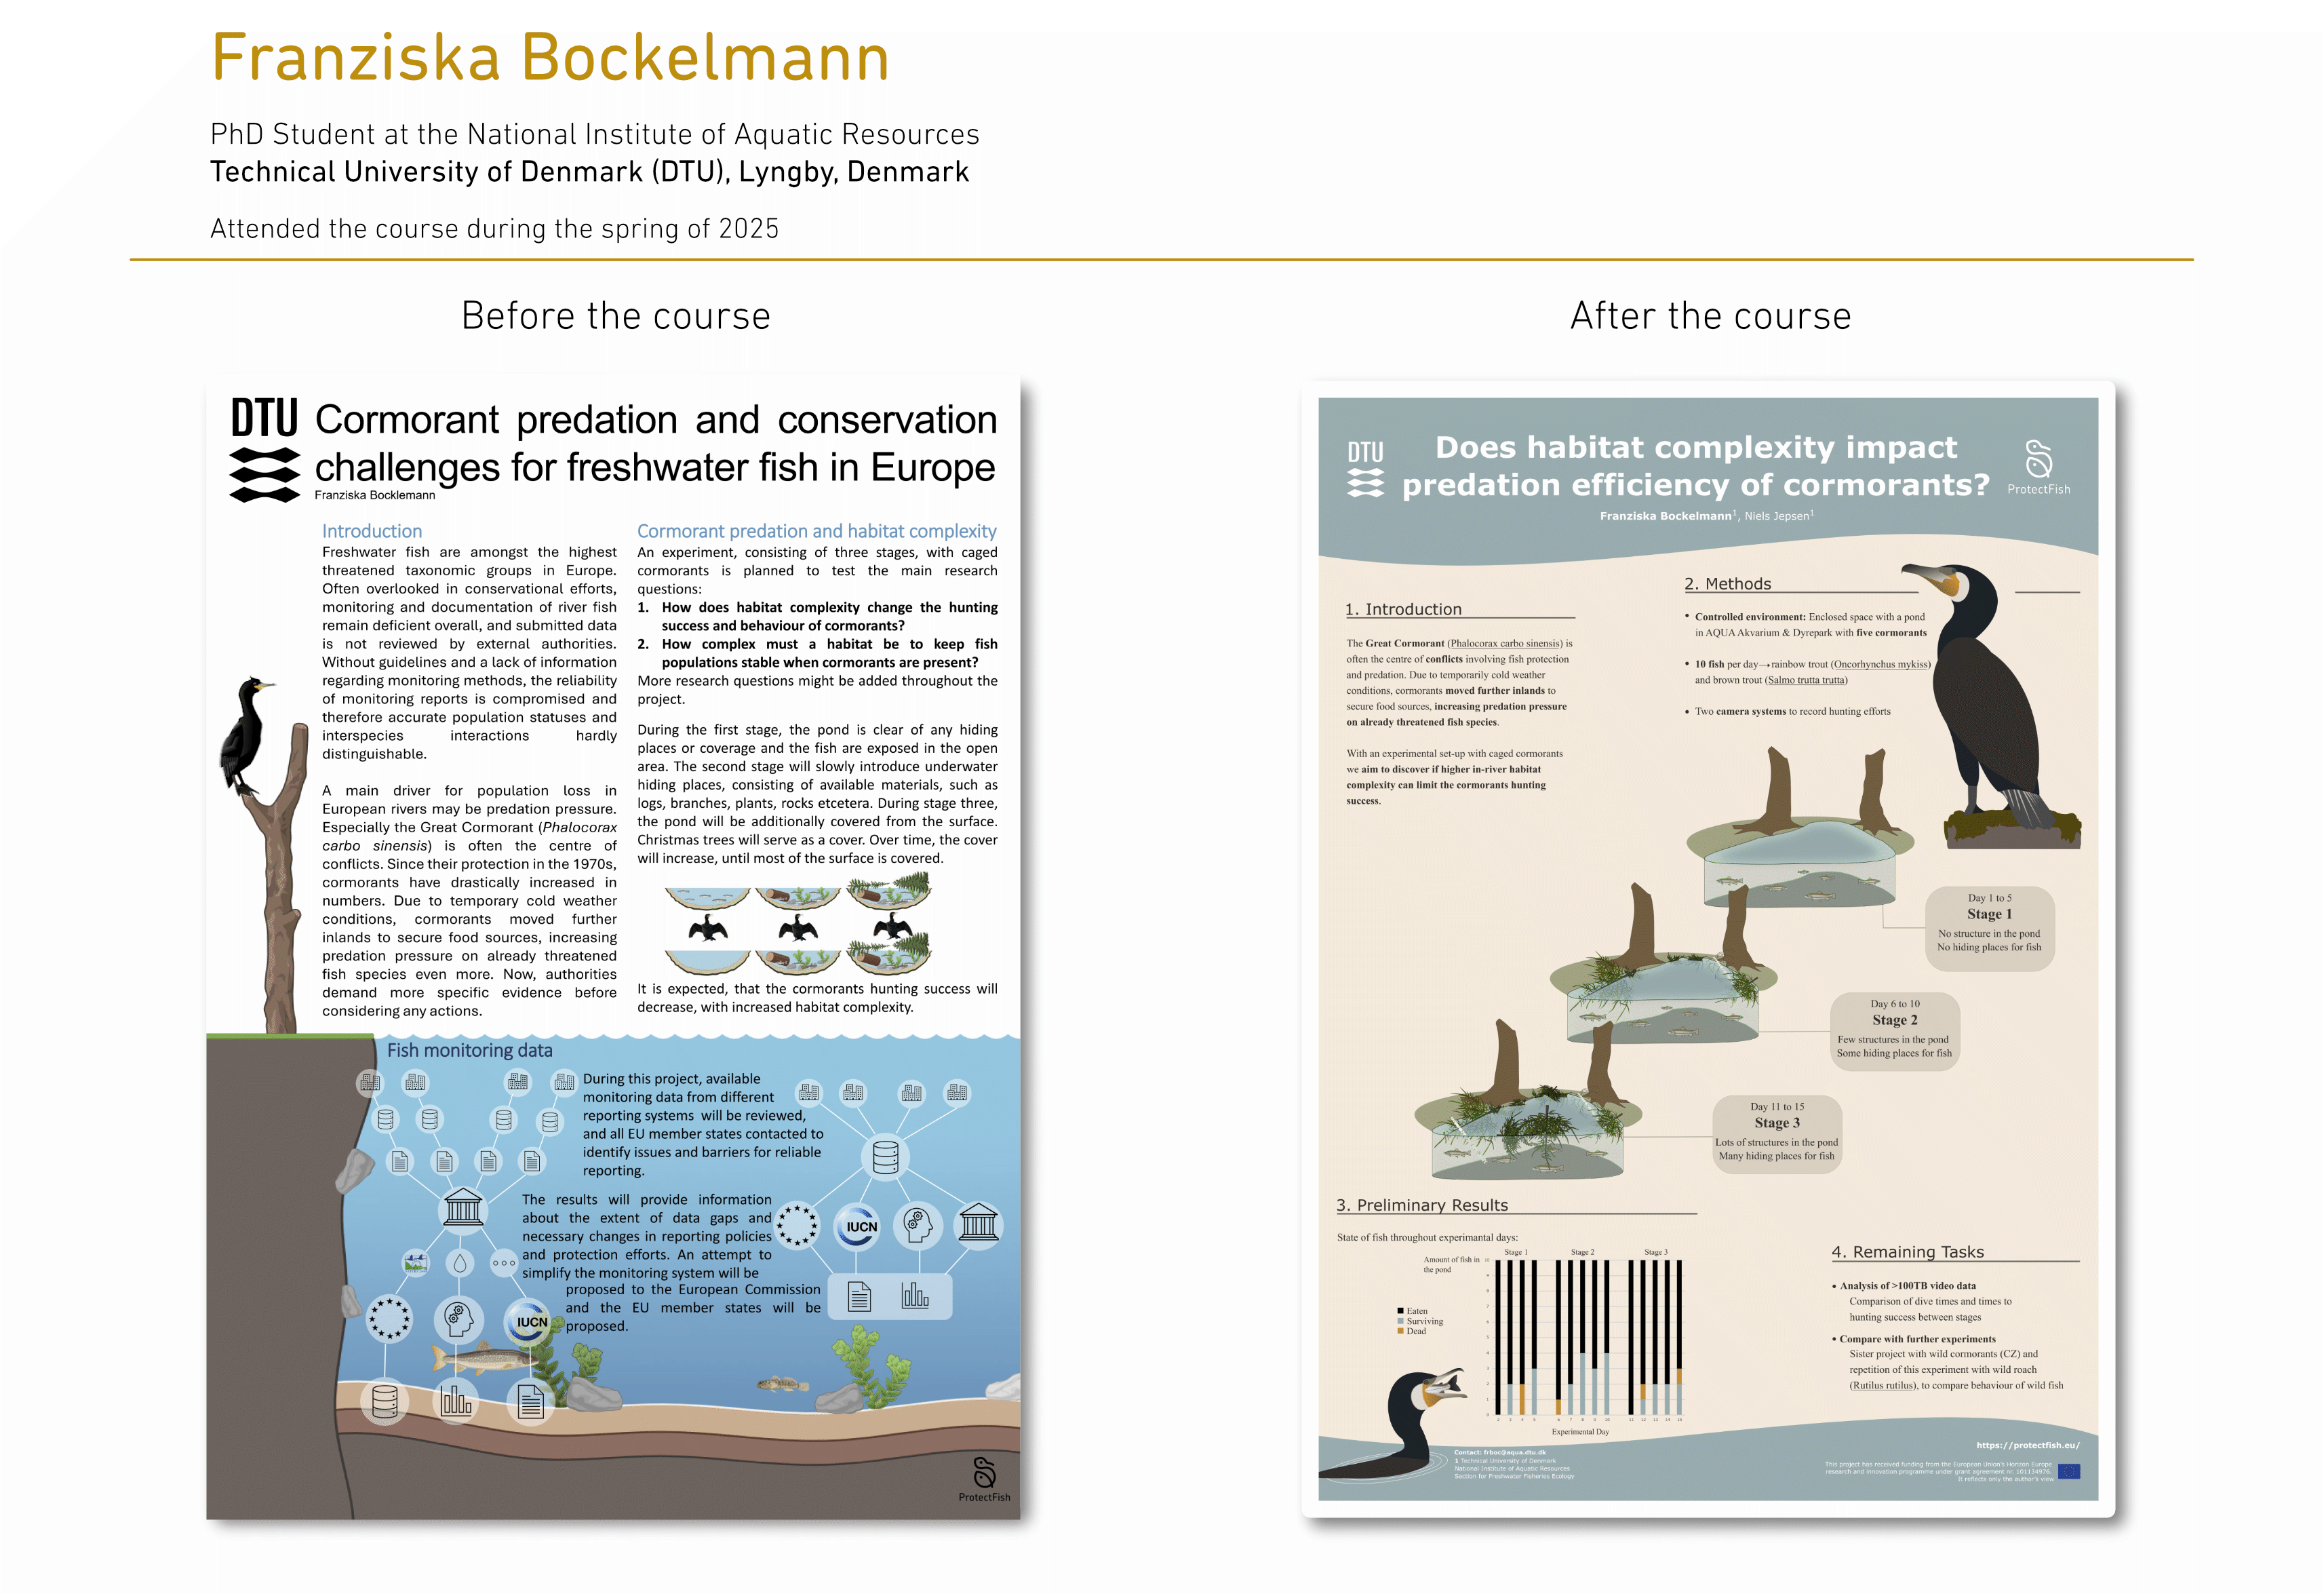
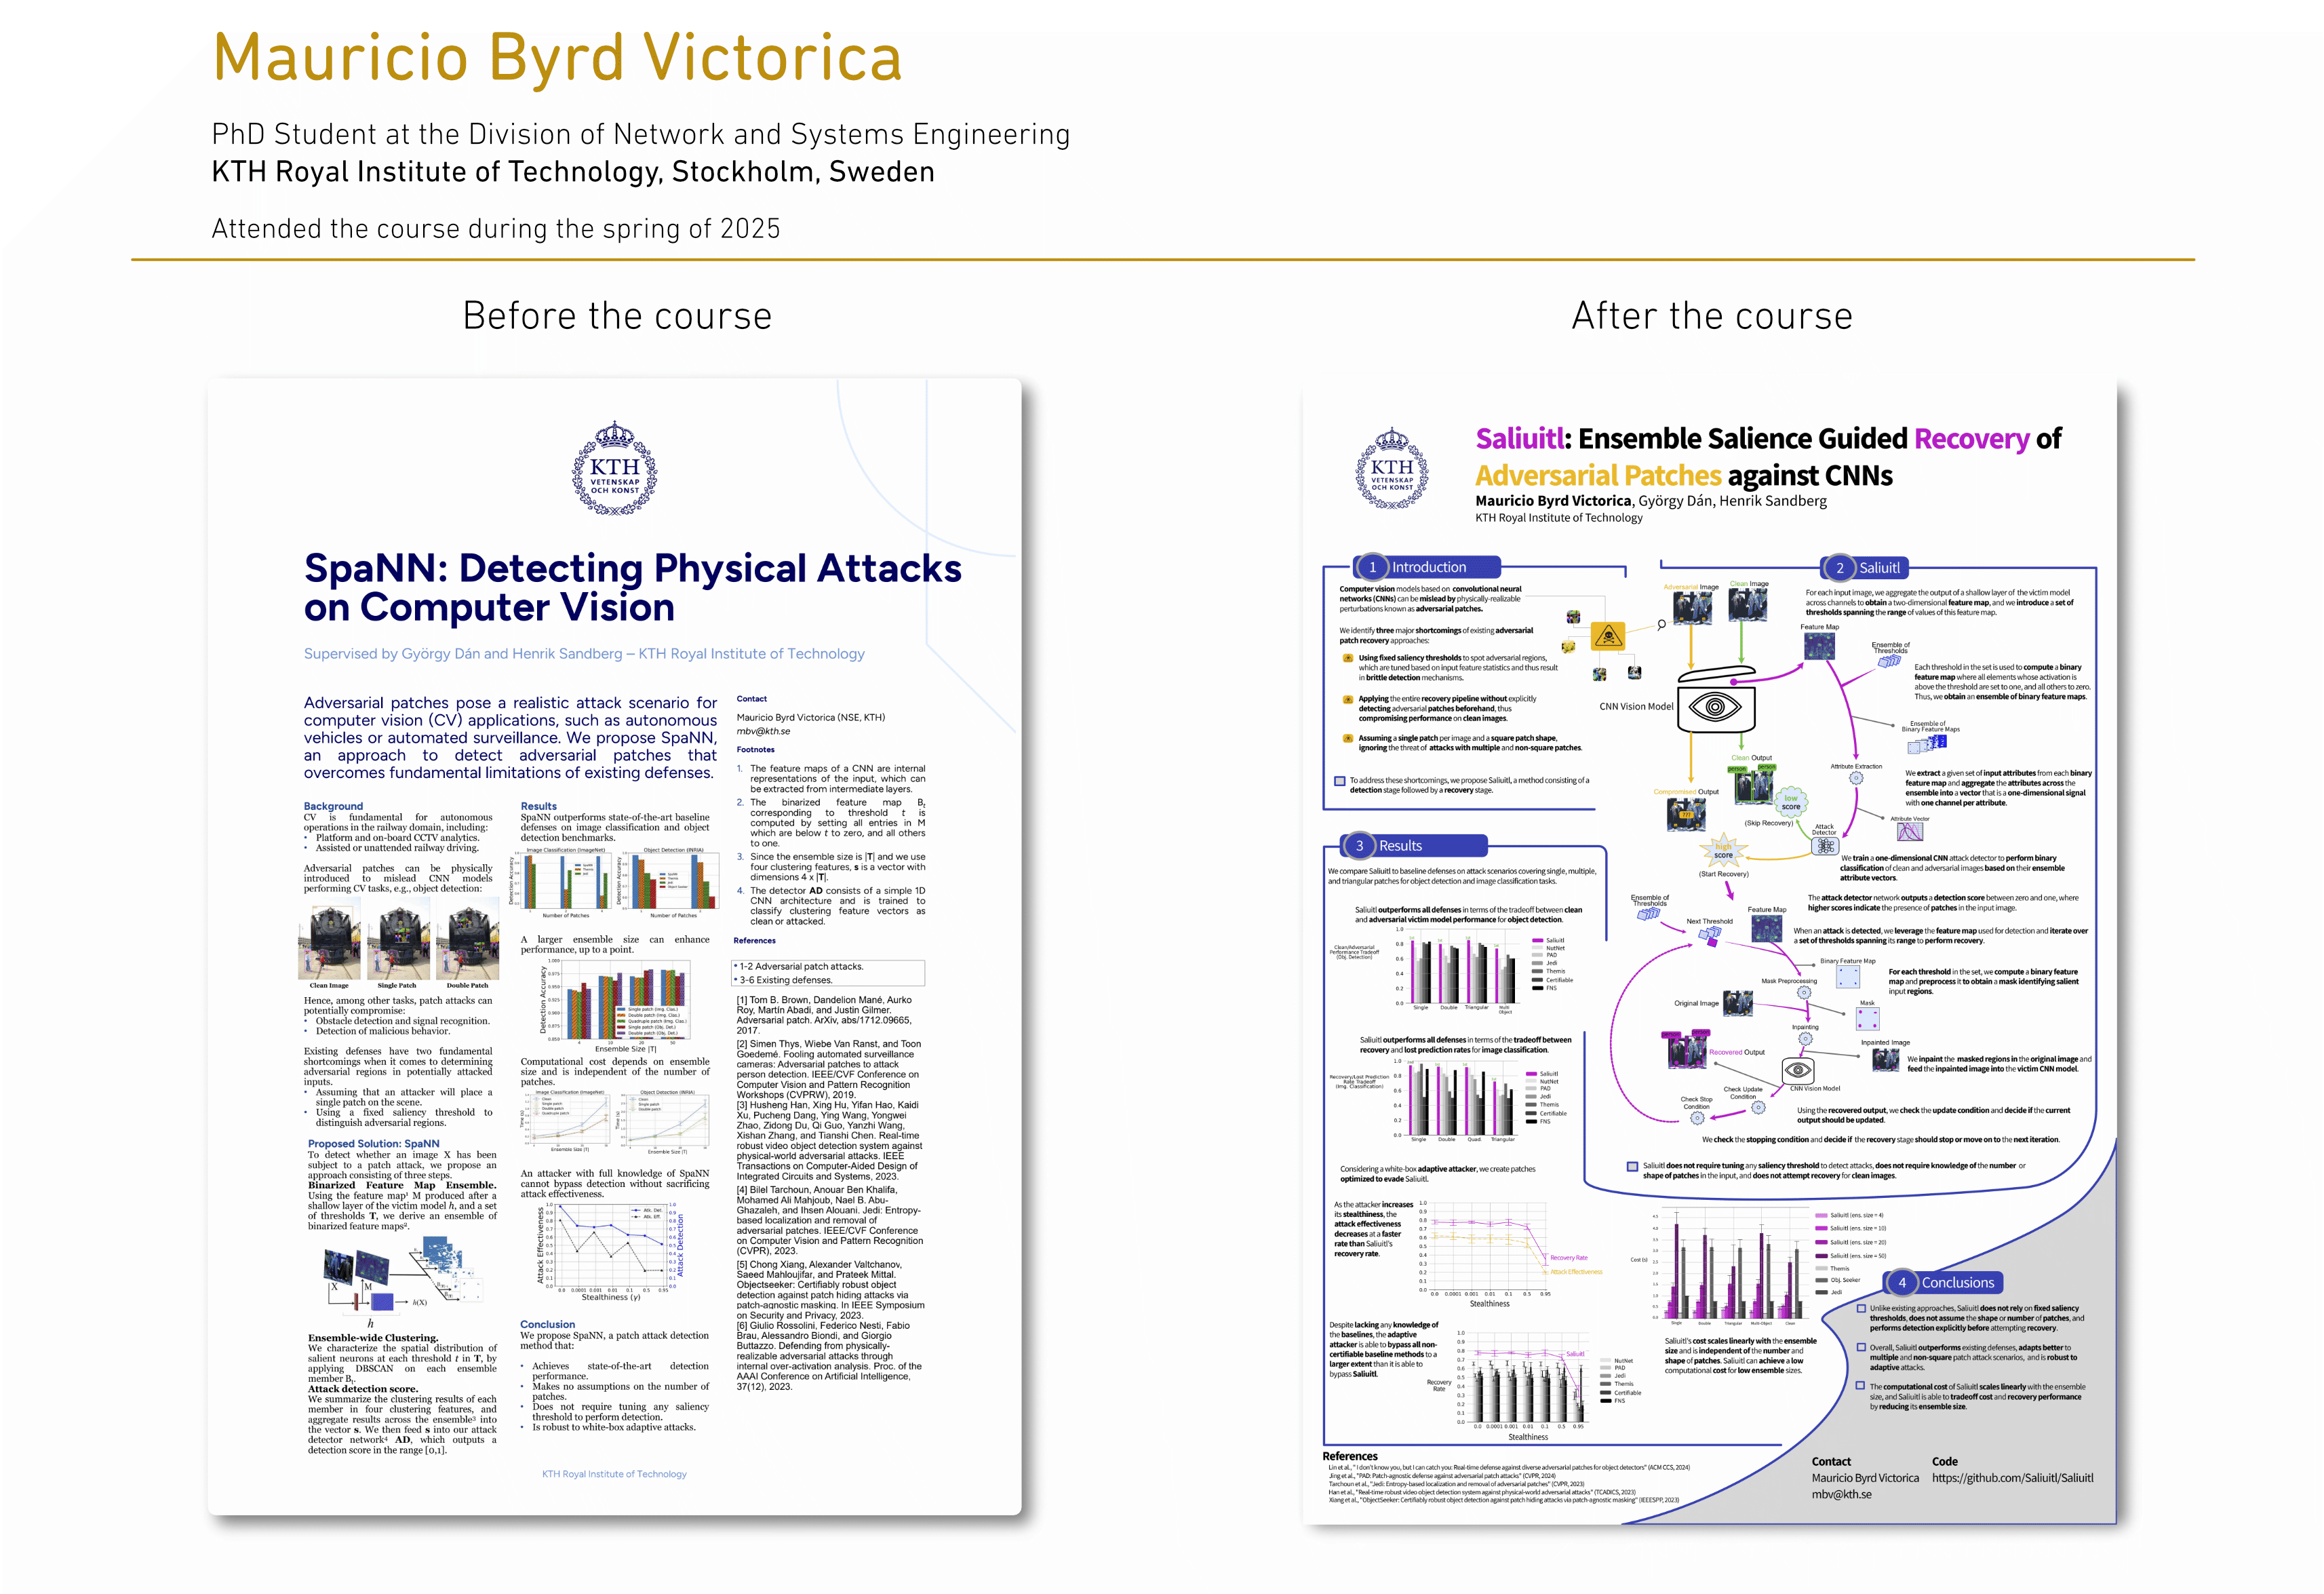
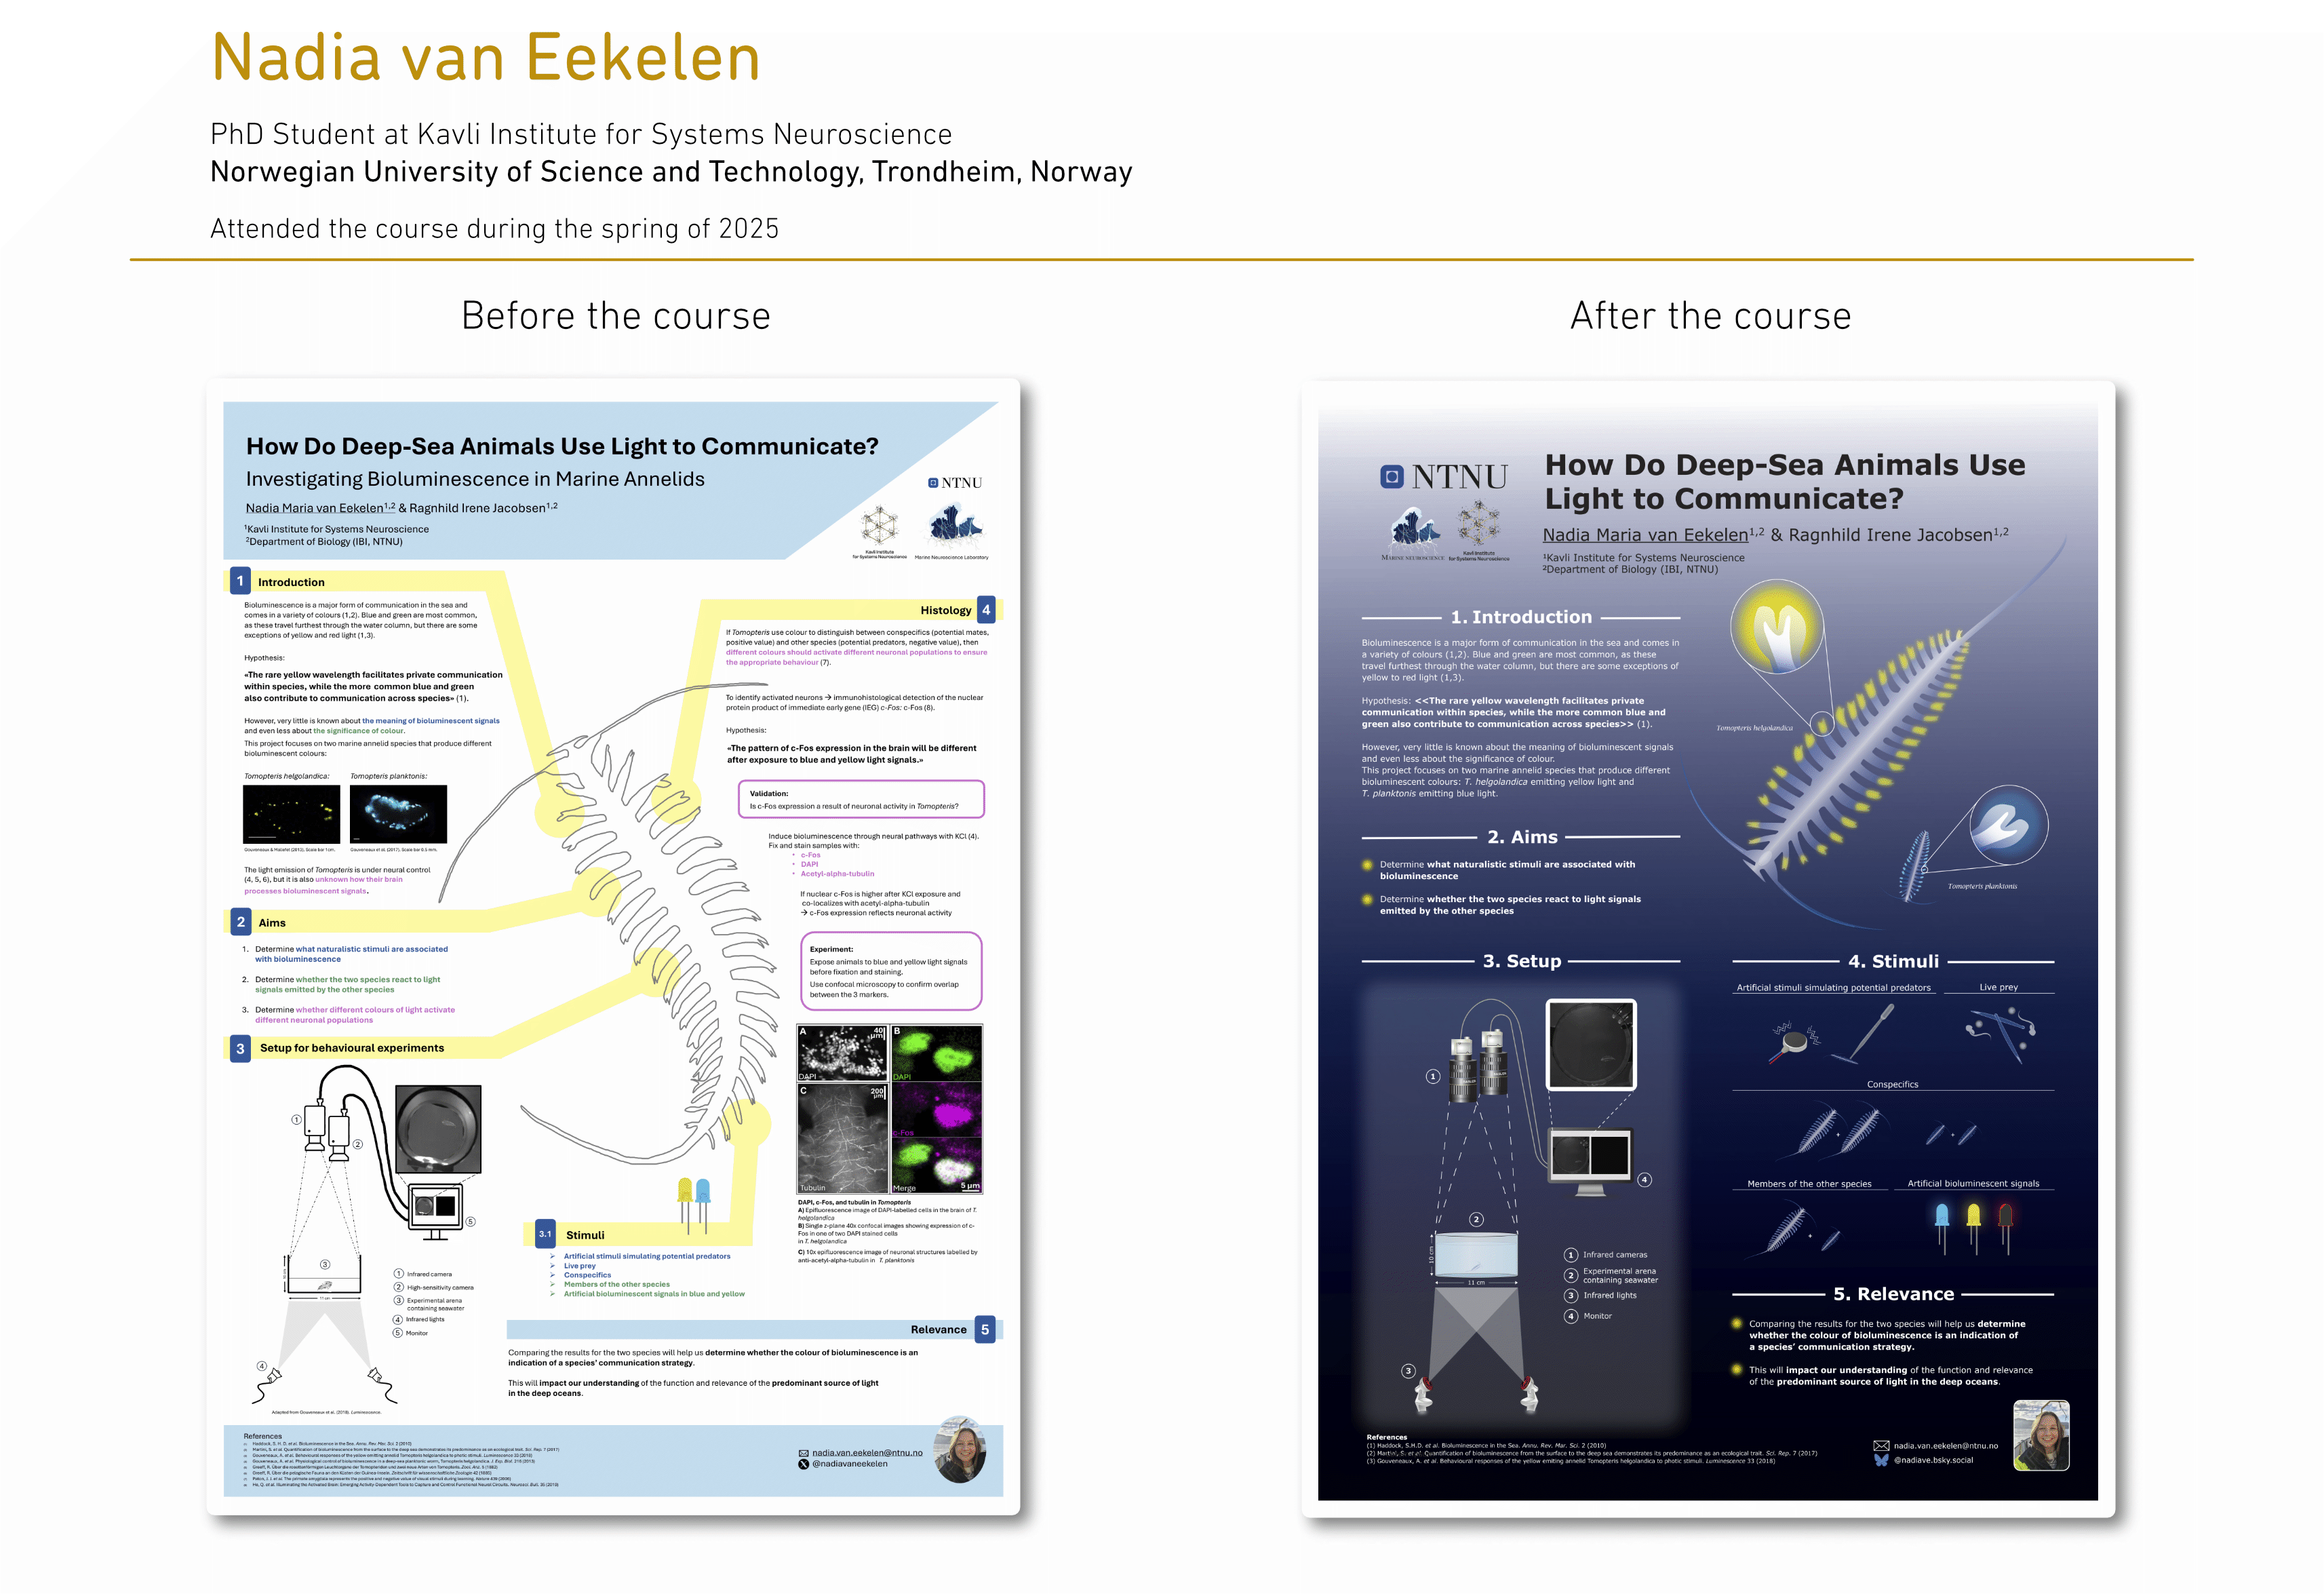
Poster transformations - Before and after

Get in touch
-
Visualize your Science AB,
Company ID: 2754269-4 -
Puolikkotie 8:5, 02230 Espoo, Finland
-
support@visualizeyourscience.com
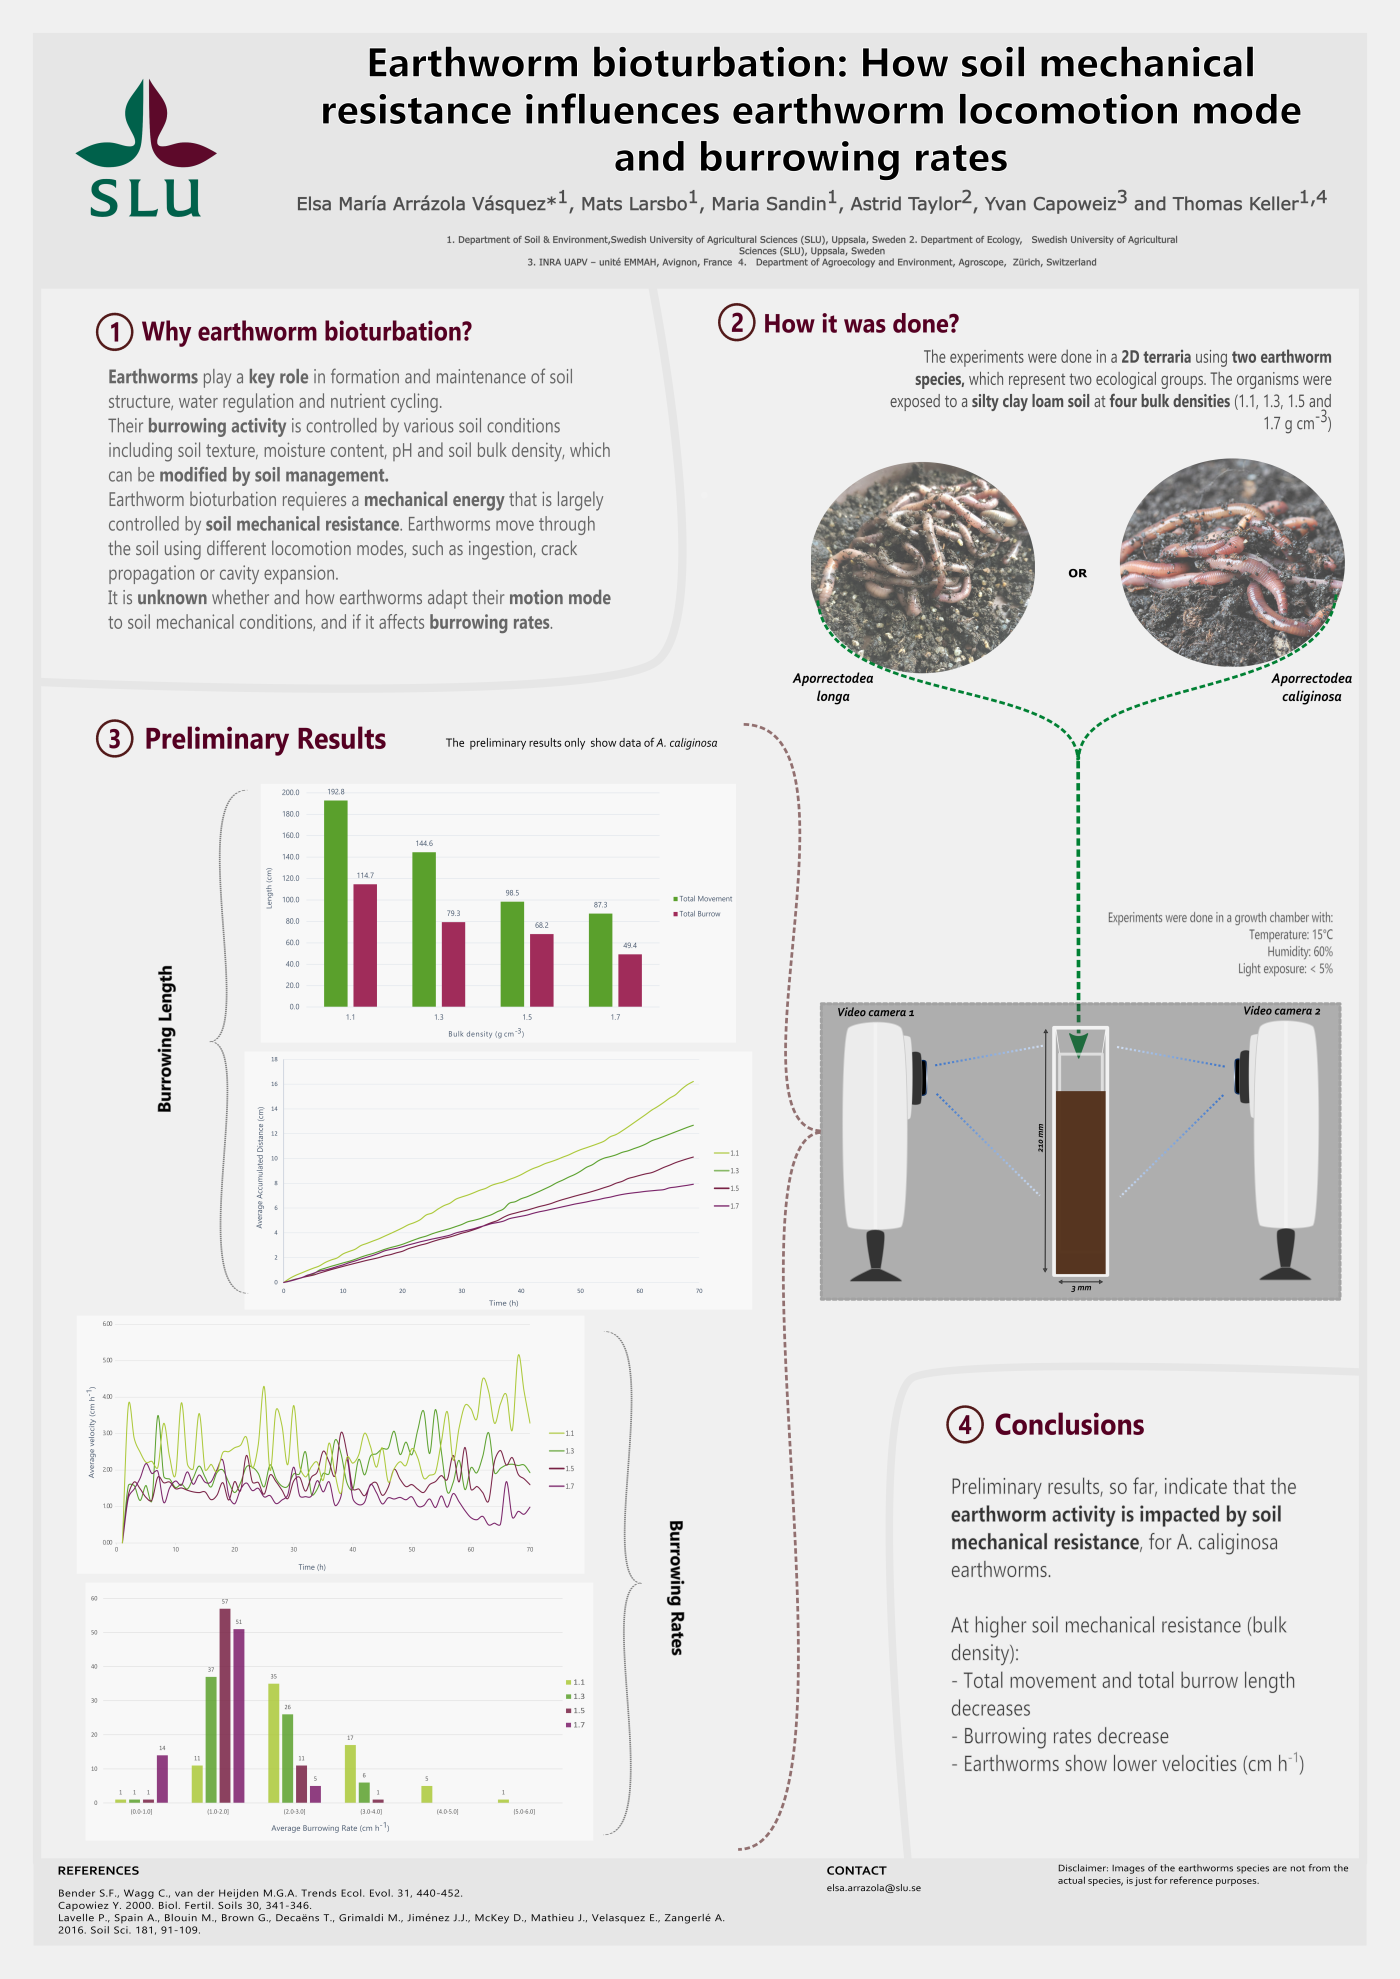
Elsa Arrázola
Pallette

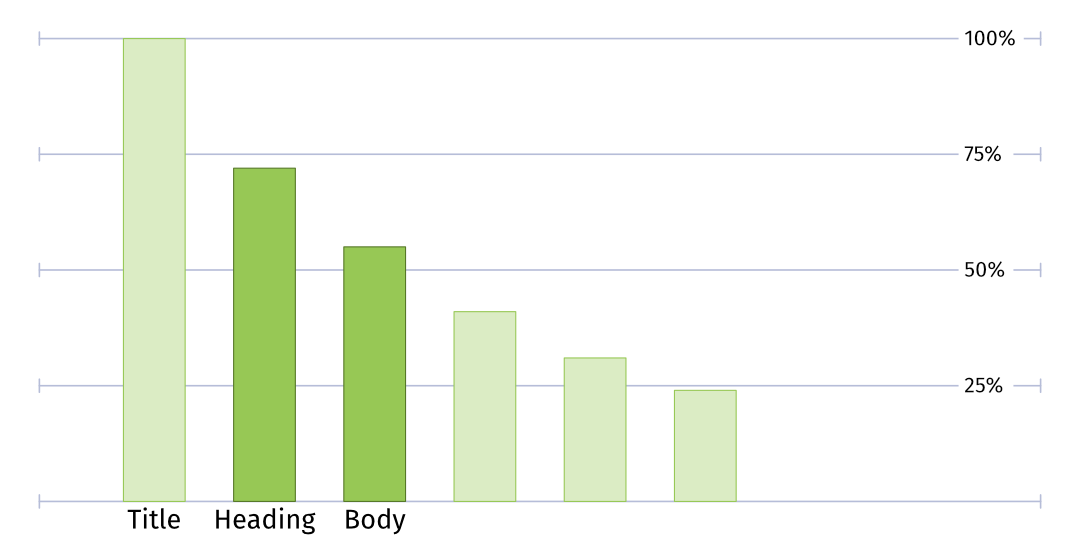
Text hierarchy
